

Most comparisons of traditional media buying vs digital media buying end with the same recommendation: use both. That advice is correct and incomplete, because it skips the decision a CMO actually faces, which is how much to commit to each model, on what evidence, and through which partners. The two approaches differ less in what they can achieve than in what they let you observe. Digital buying, which in US display is now dominated by automated auctions carrying over 90% of US digital display ad spending, produces fast, granular, seller-reported data. Traditional buying produces contractual certainty and scale, with measurement that arrives late and estimated. This guide compares the mechanics, cost structures and measurement of each, then lays out an allocation framework and the partner-evaluation questions a mixed plan requires.
The traditional-versus-digital argument is usually conducted with numbers that were never built to be compared. A platform ROAS is an attribution figure produced by the company selling the inventory. A television result is a modelled estimate of who was probably exposed. Neither observes what would have happened had the money not been spent. Our view is that the useful question is not which medium performs better in the abstract, but which business decision each channel must support and what measurement you are prepared to fund to answer it honestly. Settle that, and allocation follows. So does the standard you hold partners to: demonstrated incremental contribution, disclosed fees and reporting you can audit, rather than dashboards that award credit to themselves.
TL;DR
- Traditional media buying is negotiated, committed in advance and measured mostly through audience estimates; digital media buying is largely automated, adjustable during flight and measured through platform-reported events.
- Programmatic carries over 90% of US digital display ad spending, so digital buying in practice means a layered supply chain with its own fees and verification costs rather than a simple self-serve dashboard.
- Digital's measurement advantage is real but partial: platform attribution reports correlation and last-touch credit, not incremental profit, so it cannot settle the traditional-versus-digital question alone.
- Traditional still earns budget where mass reach, frequency control against a broad audience, contractual placement certainty or category credibility matter more than per-user targeting.
- Allocate by the decision each channel must support and the measurement you can afford to run, then hold agency partners to evidence standards that fit each medium instead of a single ROAS number.
Read the five points and note which one you cannot currently answer for your own plan. That is the section to read first.
Where Traditional and Digital Media Buying Actually Differ
The clearest way to separate the two models is to ask, for each channel, what you can observe and what you can change while the campaign is running. Everything else, including the old-versus-new framing common in most comparison guides, follows from those two questions.
Planning versus buying: the boundary that agency scopes hinge on
Media planning is the strategy layer: objectives, audience definition, channel mix and budget split. Media buying is execution and optimisation: securing inventory, negotiating or bidding, trafficking, pacing and reporting. The two are frequently bundled in a single agency contract, which is fine as long as the contract says which layer the partner owns and which decisions it can take without you. Problems arise when a buying partner is asked to defend a channel mix it did not design, or a planning partner is judged on delivery it did not control. For a general walkthrough of how the functions fit together, see AI Digital's overview of planning and buying. Write down, for every channel on your plan, who plans it, who buys it and who produces its performance data.
How inventory is bought: negotiated contracts versus automated auctions
Traditional inventory across television, radio, print and out-of-home is bought through negotiation. Rate cards set a starting point, upfront and scatter markets set the timing, and the contract fixes units, positions, dates and cancellation terms. Digital inventory is bought three ways: direct deals with publishers, self-serve buying inside walled-garden platforms, and programmatic exchanges where software bids on impressions in real time. Programmatic is the default rather than a niche: it accounts for over 90% of US digital display ad spending according to eMarketer's 2026 guide. The shift from human negotiation to automated auctions is what most writers mean when they describe how digital transformed the agency landscape, a history letsbmedia summarises from the agency side.
Targeting: audience proxies versus individual-level signals
Traditional buying targets by proxy. You buy a programme, a daypart, a title or a location because audience estimates say the people you want are likely to be there. Digital buying targets at the impression level using behavioural, contextual and first-party signals, with precision that varies widely by platform and is constrained by privacy rules. Proxy targeting wastes impressions on people outside the audience but reaches everyone inside the context. Signal targeting narrows waste but depends on data quality you did not collect and often cannot inspect.
Timing and flexibility: lead times, cancellation windows and in-flight changes
A traditional flight is committed weeks or months ahead and carries cancellation deadlines after which the budget is spent whether or not conditions change. In return, you know where your ad will appear. A digital line can be paused, re-weighted or re-targeted within hours. The cost of that agility is that you rarely know in advance where an impression will run. Comparison guides from media.co.uk and PM both organise the topic around this flexibility trade, and it is the right axis, provided you also ask who produces the data behind it.
Measurement: estimated audiences versus logged events
Traditional measurement relies on panel ratings, circulation audits and post-buy reconciliations that arrive after the flight. Digital measurement logs impressions, clicks and conversions in near real time. The important qualifier is that those logs are generated by the seller or the seller's platform. They are precise, but precision about what a platform chose to count is not the same as certainty about business effect, a point developed in the incrementality section.
| Dimension | Traditional media buying | Digital media buying | What this means for the buyer |
|---|---|---|---|
| Inventory access | Negotiated contracts, rate cards, upfront or scatter markets | Direct deals, walled-garden self-serve, programmatic auctions | Digital adds intermediaries between you and the publisher |
| Targeting basis | Programme, daypart, title, location, audience estimates | Behavioural, contextual and first-party signals per impression | Precision depends on data you do not own |
| Commitment window | Weeks to months, with fixed cancellation deadlines | Hours to days, continuously adjustable | Certainty and agility are traded against each other |
| In-flight changes | Limited to make-goods and creative rotation | Budget, targeting and creative can change daily | Digital rewards active management; traditional rewards good upfront planning |
| Who produces the data | Independent panels and audits, delayed | The selling platform, in near real time | Fast data still needs independent validation |
The programmatic share figure in this section comes from eMarketer; the remaining rows are descriptive. Hypothetical illustration: a regional retailer books a six-week scatter TV flight with a fixed cancellation date while its agency trading desk adjusts a programmatic display line every day. Both are media buying, yet the contract, targeting basis and reporting owner differ in every column.
Cost Structures and ROI: What Each Model Lets You Count
Cost is the reason most budgets migrated to digital, and it is also where the comparison is most often done badly. Each model prices inventory differently, leaks money differently and reports return in a different currency.
How traditional media is priced and where the money leaks
Traditional pricing runs on rate cards, negotiated CPMs or cost per rating point, plus production and any added value the seller throws in. Leakage appears as under-delivery against guaranteed audience, make-goods that arrive in weaker positions, and audience estimates that simply miss who watched or read. The core defence is the post-buy: a reconciliation of delivered audience against the guarantee, with the make-good terms written into the contract before the flight runs. Guides on budgeting media buying costs generally treat production and agency remuneration as separate lines from working media, and that separation is the habit to keep.
How digital media is priced and where the money leaks
Digital pricing runs on auctions cleared at CPM, CPC or CPA, layered with platform fees, DSP fees, data fees and agency fees. Leakage appears as invalid traffic, made-for-advertising inventory, impressions that were never viewable and take-rates claimed by each intermediary. Because so much of display now clears through automated auctions, these leaks are structural rather than occasional. Public benchmark reports for search advertising and programmatic display click-through rates also illustrate why platform metrics differ so much by channel that pooling them into one number yields a figure with no meaning.
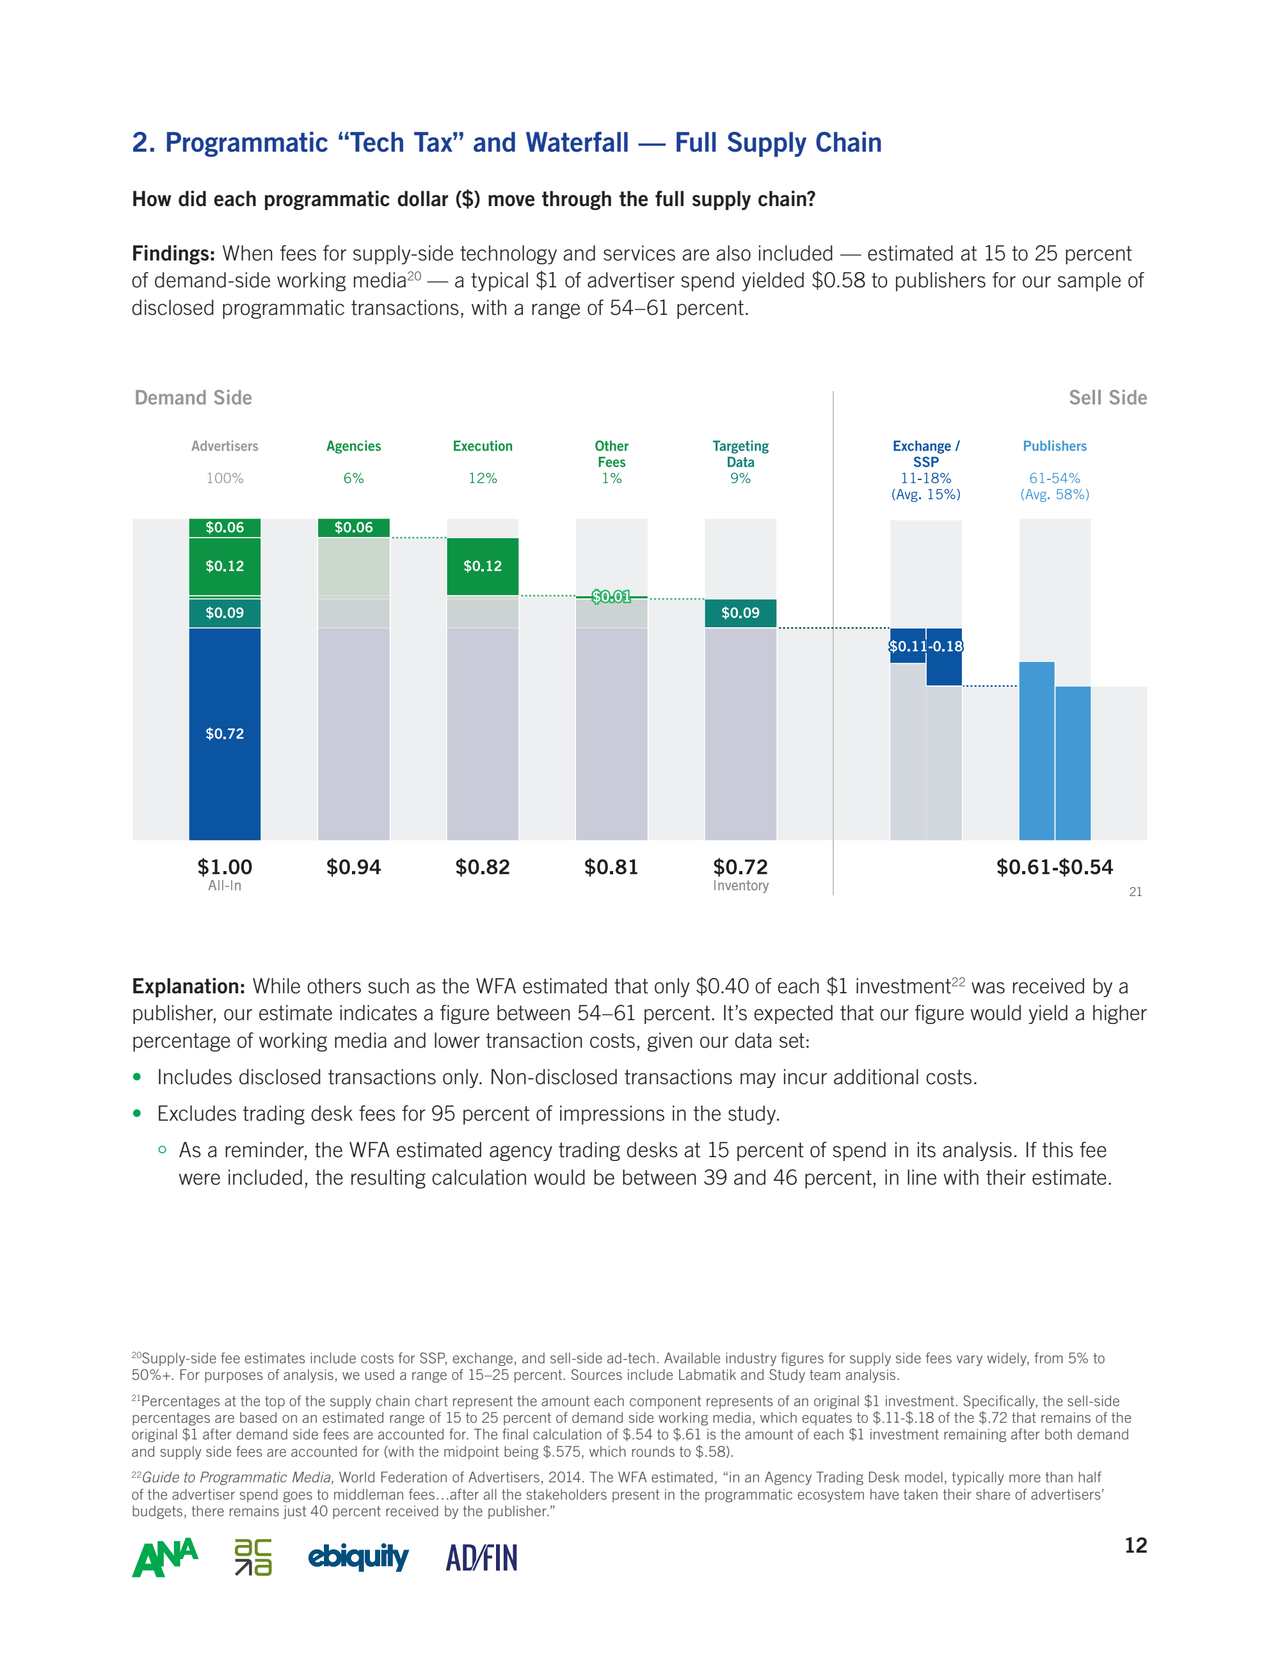
The programmatic fee stack and verification costs buyers rarely budget
A programmatic dollar passes through the agency, a DSP, one or more exchanges, an SSP and often a verification vendor before it reaches a publisher. Since programmatic represents over 90% of US digital display ad spending, this stack is the normal path for display, and the tools that keep it honest are part of the cost of buying it: ad verification, brand safety filtering, supply path audits and log-level data access. Budgets that treat these as optional extras understate the true cost of digital and overstate its efficiency relative to a direct traditional contract. Budget flexibility cuts the other way. Digital can be paused or reallocated in hours; traditional commitments often cannot. That rigidity is the price of placement certainty, not a defect.
Why reported ROAS and estimated CPMs are not comparable numbers
A platform ROAS is an attribution figure the seller computed using rules the seller set. A TV or out-of-home result is usually a modelled or survey-based estimate of exposure or lift. Neither is profit. Putting a 5.0 ROAS beside a reach-and-frequency plan and calling one cheaper produces false precision, a trap that ROI-focused comparisons such as those from 2X Sales and Periphery Digital can fall into when they rank channels on reported return. The honest comparison is working media percentage: how much of gross spend reached a verified human in the intended context. GPI's guide to evaluating agency performance by profit explains why reported return is a starting hypothesis rather than a result.
| Cost component | Traditional media | Digital / programmatic | How to verify it |
|---|---|---|---|
| Media price basis | Rate card, negotiated CPM or CPP | Auction-cleared CPM, CPC or CPA | Request net-versus-gross invoice; request auction and win-rate logs |
| Intermediary fees | Agency commission or fee | Agency, DSP, exchange, SSP and data fees | Fee schedule disclosed line by line before signing |
| Production and creative | Separate line, often large | Separate line, often iterative | Confirm which line the fee covers |
| Delivery risk | Under-delivery, weak make-goods | Invalid traffic, MFA sites, unviewable impressions | Post-buy reconciliation; third-party verification report |
| Verification cost | Audit and affidavit handling | Brand safety, viewability and fraud tools | Ask who pays the vendor and who sees the raw output |
| Flexibility cost | Cancellation windows lock spend | Premium direct deals reduce agility | Read the cancellation and minimum-commitment clauses |
The programmatic share figure above is from eMarketer; the other rows describe cost mechanics and carry no benchmark values. Hypothetical example: two plans each spend one million. The traditional plan reports 92% working media after commission and production. The programmatic plan reports a 5.0 ROAS, but once DSP fees, data fees, verification and unviewable impressions are stripped out, a materially smaller share of spend reached a human viewer. The ROAS figure alone would never reveal that. Before comparing the two, request a working-media reconciliation from the digital partner (gross spend, each fee layer, verified impressions) and a net-versus-gross post-buy from the traditional partner.
The Incrementality Problem Neither Side Solves on Its Own
Neither model measures what a CMO most wants to know: what happened because of the spend that would not have happened otherwise. Understanding why each falls short is the precondition for designing tests that work across both.
What platform attribution actually measures
Platform attribution assigns credit to a tracked touchpoint under rules the platform chose. It does not observe the counterfactual. As a result it systematically favours channels closest to the conversion and channels that own the measurement. Because over 90% of US digital display ad spending runs through programmatic systems, most display measurement is produced inside automated pipelines whose reporting logic the buyer did not design. That is a reason to validate the output independently, not a reason to discard it.
Why traditional lift estimates are also models
Traditional results usually come from panel estimates, brand-lift surveys or marketing mix models. All three are inferential and depend on assumptions about sampling, recall or model specification. They are not more honest than platform data, just uncertain in a different way. Academic comparisons of traditional and digital marketing effects, such as papers in the HighTech and Innovation Journal and IJFMR, are useful background but cannot observe your brand's counterfactual either.
Overlap: when digital claims credit for demand traditional created
Overlap is the central omnichannel measurement failure. Television or out-of-home raises branded search volume; paid search and retargeting capture the click and report the conversion; the traditional channel appears to have produced nothing. Signal loss makes this worse. As cookies deprecate and privacy regulation tightens, user-level digital attribution weakens, a shift the industry was already wrestling with in MediaPost's 2021 reporting on privacy-compliant measurement. That article is dated context rather than a current benchmark, but the direction it described has held: measurement is moving back toward aggregate methods that both media types can share.
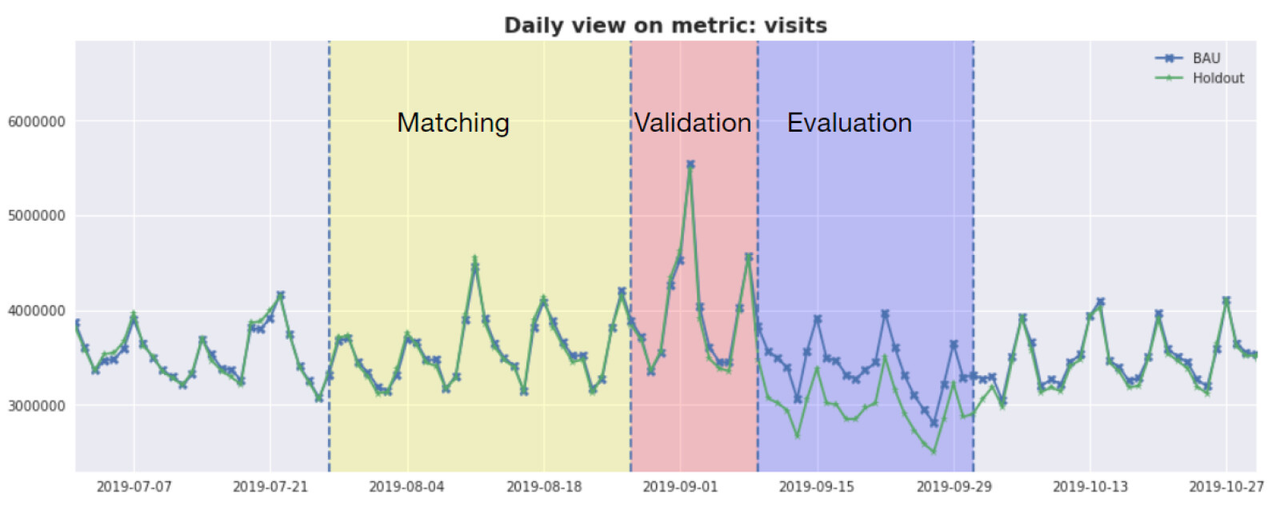
Tests that work across both: geo holdouts, matched markets and spend-shock analysis
The methods below compare exposed and unexposed groups rather than tracking individuals, which is why they work for a TV flight and a programmatic line alike.
| Method | Answers which question | Works for traditional | Works for digital | Minimum conditions |
|---|---|---|---|---|
| Geographic holdout | Does removing the channel reduce outcomes in dark markets? | Yes | Yes | Separable regions, enough conversions per region, flight long enough for lag |
| Matched-market flight | Does adding weight in test markets lift outcomes versus controls? | Yes | Yes | Comparable market pairs, stable baseline, pre-period data |
| Platform conversion-lift study | Does exposure inside one platform cause incremental conversions? | No | Where offered | Platform participation, sufficient scale, acceptance that the platform runs it |
| Spend-shock analysis | Did a sharp change in spend move outcomes beyond trend? | Yes | Yes | A large deliberate change, clean time series, few concurrent changes |
| Mix model calibrated with experiments | How should budget split across all channels? | Yes | Yes | Multi-year data, variation in spend, experimental anchors |
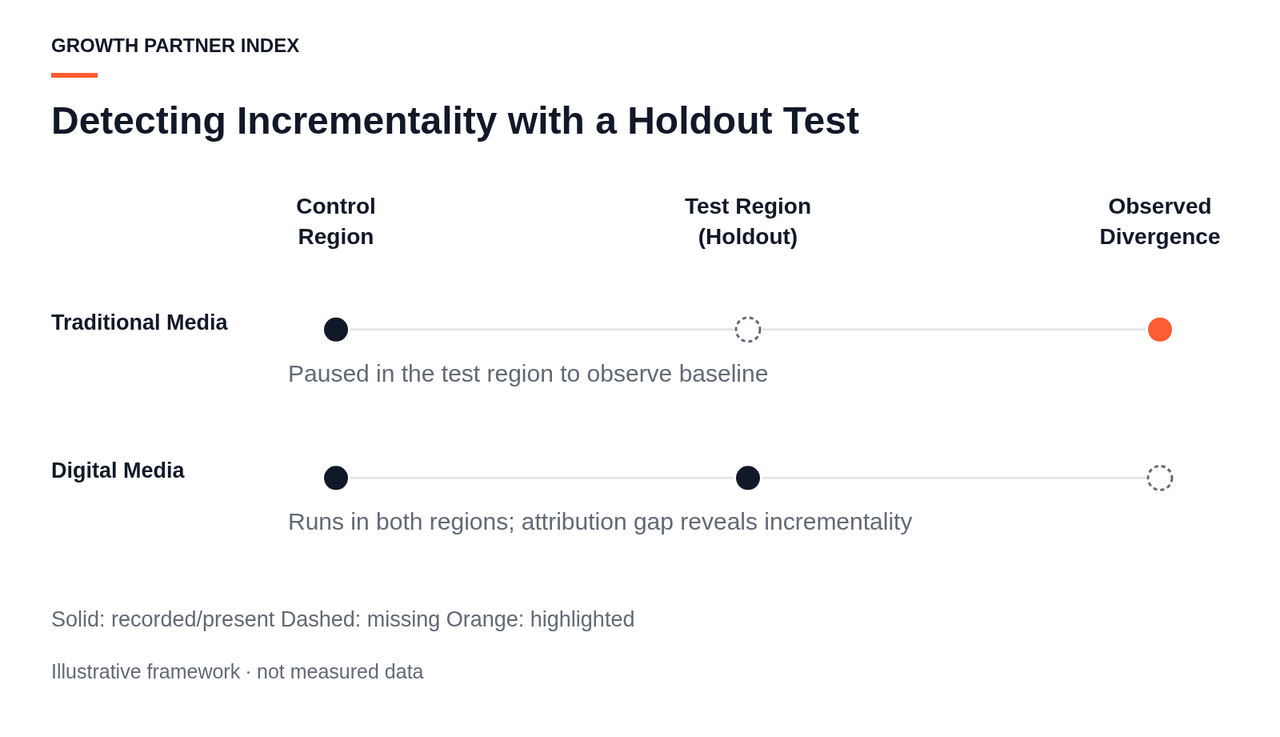
Rows are methodological descriptions, not empirical results. Hypothetical example: a brand pauses regional TV in three matched markets for six weeks while holding digital constant. Branded search and paid-search conversions in the dark markets fall relative to control. The dashboards had credited those conversions to search; the test reassigns part of that credit to TV. Pick one pairing where you suspect overlap, state a hypothesis and a decision rule, and run the test before the next budget cycle. More dashboards will not answer the question; a test can.
When Traditional Media Buying Still Wins, and When It Does Not
The condition-based view below is more useful than a list of pros and cons because it maps directly to campaign line items. Refer back to the mechanics table for how each model works and to the cost table for where money leaks; this section is about choosing.
Conditions that favour traditional buying
Traditional earns its place when the objective is broad-market or category-launch reach, when frequency must be controlled against a mass audience, when placement certainty in a premium context matters, when the market is regulated or local, and when the audience is under-represented in digital signal. In each case the value is contractual: you know what will run and where. The cost is agility, because cancellation windows lock the spend.
Conditions that favour digital buying
Digital earns its place when the audience is narrow or intent-defined, when creative and budget need rapid iteration, when the objective is direct response with a trackable outcome, and when the budget is too small to buy meaningful broadcast frequency. Certainty has its own cost here: premium direct deals restore some placement guarantee but give back flexibility. Overviews of the state of media buying tend to stress this agility, and it is real, provided the verification routine runs alongside it.
Trust and inventory quality: different failure modes, not a clean winner
Traditional risks under-delivery and audience-estimate error. Programmatic risks invalid traffic, made-for-advertising inventory, unviewable placements and brand-safety incidents. Since programmatic carries over 90% of US digital display ad spending, those automated-supply risks apply to the bulk of display buying rather than a corner of it. Neither medium is inherently safer. Digital verification means inclusion lists, supply path optimisation, third-party verification and log-level access. Traditional verification means affidavits and post-buy reconciliation against the guarantee.
| Campaign condition | Lean traditional | Lean digital | Verification you must run |
|---|---|---|---|
| Mass awareness or category launch | Yes | Supporting role | Post-buy reconciliation, affidavits |
| Narrow or intent-defined audience | Rarely | Yes | Inclusion lists, verification report |
| Direct response with trackable outcome | Rarely | Yes | Holdout test against platform attribution |
| Premium placement certainty required | Yes | Direct deals only | Contract positions, screenshots or affidavits |
| Budget too small for broadcast frequency | No | Yes | Supply path audit to protect small budgets |
| Audience under-represented in digital signal | Yes | Contextual only | Panel methodology review |
| Rapid creative iteration needed | No | Yes | Log-level access to confirm delivery |
The table is a conceptual decision aid, and the programmatic share cited above is from eMarketer; it does not establish market share, reach or fraud rates for any other channel. Comparison pieces such as media.co.uk's reach similar hybrid conclusions without the condition detail. Hypothetical example: a national CPG launch needing awareness across all adult households leans on TV and OOH for reach and frequency, then uses digital to reach light-TV segments and run direct response. A B2B software firm with a tightly defined buying committee would find the same TV plan almost entirely wasted. Score each planned campaign against the table and flag any line where medium and objective disagree; those are the first candidates for reallocation or a test.
Building the Mix: An Allocation and Operating Framework
Competitor guides stop at the word hybrid. Your actual task is an allocation and workflow decision, which needs an ordered process. Use the condition table and the test designs above as inputs to the steps below.
- State the business decision each channel must inform. Start with the decision, not the channel: grow category penetration, lower cost per acquisition, defend share in a region. Measurement and channel choice follow from it. A channel that cannot be tied to a stated decision is a candidate for cutting regardless of its dashboard.
- Match measurement design to that decision. Assign each channel a role (reach, activation, retention) and an evidence standard that fits the medium. Do not ask a TV buy to prove last-click ROAS or a search buy to prove brand lift. Pick the test from the incrementality table that answers the decision in step one.
- Set allocation by role and evidence quality, not channel reputation. Fund channels with demonstrated incremental results first. Hold a fixed test budget for the unproven channel. Treat platform-reported efficiency as a hypothesis until an experiment confirms it. GPI's guide on paid media budget allocation covers the expand-versus-concentrate decision in more depth.
- Align contracting cycles and workflows across both models. Traditional commitments sit on upfront and scatter calendars with hard deadlines. Digital, where automated auctions carry over 90% of US digital display ad spending, is continuous and adjustable. Build the plan calendar by fixing traditional flights first and treating digital as the flexible layer around them. Mid-year forecast changes are normal; Reuters reported in June 2025 that WPP Media had lowered its 2025 global advertising growth forecast, which is the kind of shift a flexible digital layer absorbs and a locked TV flight cannot. Market-size reports from vendors such as Dataintelo and Research and Markets differ by methodology, so use them for direction rather than precise sizing.
- Define the review cadence and the reallocation rule. Review traditional post-buys and mix model updates quarterly; review digital pacing weekly or biweekly. Write down in advance what result triggers a reallocation, so that the decision is made by the rule rather than by whoever presents the most confident dashboard.
When several partners are involved, a short RACI note prevents gaps: the planning partner is responsible for the mix and accountable to you; each buying partner is responsible for delivery in its medium; verification is owned by you or an independent vendor, never solely by the partner being verified; measurement design is owned by you, with partners consulted.
Hypothetical example, with the percentage chosen for illustration rather than as a benchmark: a retailer fixes Q4 TV and OOH flights by August, reserves 10% of digital budget as a holdout and test pool, runs weekly digital pacing reviews and a single post-season geo analysis to decide whether TV weight rises or falls next year. Draft a one-page media charter listing each channel's role, evidence standard, commitment window and reallocation trigger, and share it with every buying partner before the next planning round.
How GPI Evaluates Media Buying Partners Across Both Models
Growth Partner Index does not run campaigns. It assesses agencies against documented evidence, and the methodology behind the Growth Partner Confidence Score weights verified execution capability, transparency of reporting access and demonstrated incremental results above platform-attributed ROAS on its own. The ownership position behind that approach is set out on the about and disclosure page.
Evidence standards that fit each medium
A traditional partner should be able to show negotiation outcomes against rate card, a documented post-buy reconciliation practice and the methodology behind the audience estimates it plans on. A digital partner should be able to show supply path transparency, a full fee schedule, the verification vendors it uses and experience designing experiments. The digital standard matters more than it once did because programmatic now carries over 90% of US digital display ad spending, so a partner that cannot explain the supply path cannot explain where most of your display money goes.
Questions to ask before signing
- Who owns the ad accounts, seats and log-level data, and what happens to them if we part ways?
- How are fees disclosed, line by line, and which intermediaries are paid from our gross spend?
- What test do you propose to prove your own incremental contribution, and what is the decision rule?
- What will you report when a result is negative, and can you show an example?
- For traditional buys, what are the guarantee, make-good and cancellation terms in writing?
Hypothetical comparison: an agency presenting a 6.0 blended ROAS with no log-level access, no fee schedule and no holdout is weaker evidence than one presenting a 2.1 incremental return from a documented geo test. Score answers on the evidence provided, not on the confidence expressed.
For a starting shortlist of partners, browse the media buying agencies listed on Growth Partner Index and apply the evidence questions above. Any listing is a starting point for your own review, not a substitute for it.
Frequently Asked Questions
Can a single ROAS target be applied to both traditional and digital channels?
No, because the two produce return figures through different mechanisms: seller-side attribution for digital and modelled exposure or lift for traditional. A shared target invites the digital channel to look efficient by claiming conversions traditional created. Set a shared business target instead, such as incremental contribution margin or cost per incremental acquisition, then measure each channel toward it with the method suited to its medium and accept that the digital number is a hypothesis until a holdout confirms it.
How do cookie deprecation and privacy regulation change the targeting advantage digital holds over traditional?
They shrink it at the individual level and shift digital toward the aggregate methods traditional always used. User-level retargeting and cross-site attribution weaken; contextual targeting, first-party audiences and modelled conversions grow in importance. A partner proposing contextual and first-party strategies is responding to a structural change, not selling a novelty. The practical consequence is that geo and matched-market designs become the common measurement language for both media rather than a workaround for offline.
What is the minimum budget or duration for a geo holdout test to be worth running?
There is no universal figure. The test is worth running when the dark markets generate enough baseline conversions to detect the effect you would act on, when the flight is long enough to cover purchase lag, and when the budget at stake exceeds the cost of the lost sales in the holdout. Work backwards from the smallest effect that would change your allocation and ask your analyst or partner to show the detection calculation before spending.
Who should own verification and log-level data when different agencies buy traditional and digital media?
The advertiser should own both, with contracts granting direct access to ad accounts, DSP seats, verification vendor outputs and traditional affidavits. Where an independent verification vendor is used, the advertiser should hold the vendor relationship. A buying partner can operate the tools, but a partner that is the sole gatekeeper of the data used to judge its own performance has an unavoidable conflict, regardless of how honest it is.
How should a post-buy reconciliation for TV be compared with a programmatic viewability report?
Treat both as delivery checks, not effectiveness checks. The post-buy shows whether guaranteed audience was delivered and what make-goods are due; the viewability report shows what share of paid impressions had the chance to be seen. Convert each into working media: spend that reached a verified human in the intended context. That common unit can be compared across media. Neither report says anything about incremental sales, which needs the test designs described earlier.
Is a hybrid or omnichannel plan always the right answer, or can it hide a weak channel?
A hybrid plan can hide a weak channel, because blended results let a strong channel subsidise a poor one and overlap lets a poor one claim credit. The safeguard is the charter from the allocation framework: every channel has a stated role, an evidence standard and a reallocation trigger. If a channel cannot show incremental contribution to its assigned role after a fair test, the hybrid label is not a reason to keep funding it.
