

Most articles on marketing efficiency vs effectiveness settle the question with a definition and a plea for balance. That leaves the buyer where they started: holding an agency scorecard full of ROAS and CPA figures that improve every quarter while new-customer growth in the finance ledger barely moves.
The gap is structural.
Agency compensation, reporting cadence and platform dashboards all reward cost per output, and cost per output can fall while incremental contribution stays flat.
It also has a credibility cost.
In PwC's June 2024 Pulse Survey, 40% of CMOs strongly agreed that key decision-makers understand marketing's value, down from 54% in 2023. Buyers who want effectiveness have to specify it in the contract, measure it against a baseline and accept a higher reported CAC as the honest price of counting only what marketing caused.
The debate is usually framed as a matter of mindset, with the top-ranking result asking which matters more.
GPI's view is that it is a matter of contracts and measurement design. An agency paid on media percentage or a ROAS threshold will deliver what it is paid for, and the platform dashboard will confirm that it did.
The buyer's job is to pick the measurement that answers the decision that matters, which is whether spend created customers who would not otherwise have arrived, and then write that question into the incentive.
Attributed conversions are a claim. A baseline and a holdout are evidence. Hold agency claims to the standard you would apply to any other investment case, limitations included.
TL;DR: Efficiency vs Effectiveness for Agency Buyers
- Efficiency measures cost per unit of channel output, such as CPC, CPA or ROAS. Effectiveness measures whether marketing caused incremental sales, customers, share or brand equity, according to Ipsos MMA's framing.
- Organizations default to efficiency because platforms generate those numbers automatically, daily and granularly, which Ipsos MMA describes as a gravitational pull on reporting, and by extension on agency scorecards.
- Efficiency without effectiveness can make a team very good at optimizing metrics that do not move the bottom line, and can accelerate an existing weakness such as poor retention, a point made in CMSWire's roundup.
- Effectiveness requires separating incremental impact from baseline demand that would have happened anyway. For established brands, baseline can be most of total sales.
- If the agency contract pays for delivery metrics, you will get delivery metrics. Aligning incentives means paying against agreed incrementality evidence, with efficiency kept as a guardrail.
- Expect reported CAC to rise once baseline conversions stop being credited. Performance has not changed; the count has. Agree this with finance in advance.
A scorecard showing ROAS up sharply year over year while total new-customer volume is flat is the pattern this article explains. Find the bullet your current scorecard contradicts and read that section first.
What Actually Separates Marketing Efficiency From Marketing Effectiveness
Efficiency is how well budget converts into a unit of output, measured by figures such as cost per click, cost per acquisition and return on ad spend. Effectiveness is whether the investment produced real business outcomes: incremental sales, acquired customers, market share and brand equity.
The first is a ratio of spend to something the platform counted. The second is a judgement about causation.
The familiar shorthand, doing things right versus doing the right things, is true and useless to a buyer. It offers no measurement test and no language you could put in a contract.
The definitions above do:
- An efficiency metric has a denominator the platform supplies.
- An effectiveness metric has a counterfactual you have to construct.
Why marketing efficiency and marketing effectiveness can diverge
Put the two on separate axes and you get four quadrants.
- Inefficient and ineffective is easy to spot and gets fixed.
- Efficient and effective is the goal.
- Inefficient but effective is uncomfortable but survivable, because the growth is real and the cost can be worked on.
- Efficient but ineffective is dangerous because every dashboard in it looks healthy.
As one contributor in CMSWire put it, you can be efficient at optimizing metrics that do not affect the bottom line.
A healthcare example sharpens the point. Vectoron defines effectiveness in that sector by whether campaigns change patient behavior, not by message delivery or reach. Reach is an output. Behavior is the outcome. The same logic applies to a DTC checkout or a B2B pipeline.
What "efficient but ineffective" looks like in agency reporting
Let's take a hypothetical illustration: the agency deck shows CPA down 15% quarter-on-quarter, while the finance ledger shows blended new-customer CAC rising. Both figures can be accurate. The agency is counting cheaper attributed conversions; finance is dividing total spend by total genuinely new customers.
The table below separates the two lenses.
| Dimension | Efficiency lens | Effectiveness lens | Who typically owns it | How it can be gamed |
|---|---|---|---|---|
| Measurement unit | Cost per click, acquisition or attributed revenue | Incremental sales, customers, share, brand equity | Agency and channel leads | Shift spend to channels with cheap attributed conversions |
| Data source | Platform dashboard | Ledger data plus a baseline or holdout | Finance and marketing analytics | Choose the attribution window that flatters the channel |
| Time horizon | Daily or weekly | Quarterly or longer | Agency for the former, CMO for the latter | Report short windows that hide decay |
| Counterfactual | None assumed | Explicit baseline required | Buyer must specify | Credit demand that already existed |
| Contract fit | Easy to write as a threshold | Needs baseline, window and evidence standard | Procurement and CMO | Bonus triggers on platform figures alone |
The definitions in the table follow Ipsos MMA's distinction between output and outcome; the gaming column is GPI's reasoning about incentives. As a first exercise, place every metric on your current agency scorecard into one of the two columns and count how many sit on the left.
The Marketing Metrics Trap: Why Agencies and Marketers Default to Efficiency
The trap is a property of the reporting system because efficiency metrics are easier to generate, look better for leadership, and have a faster cadence. Nobody here is acting in bad faith.
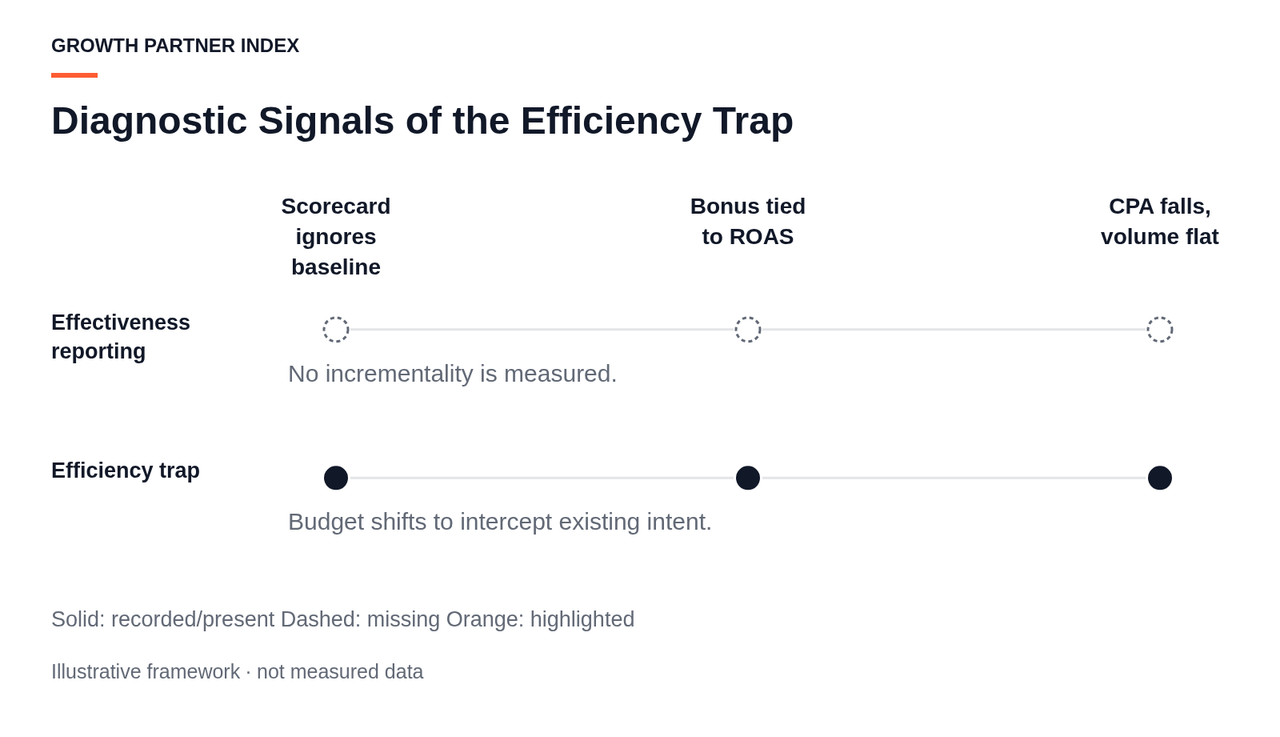
Here are the signs you're in this trap, why, and what to ask your agency:
| Signal you are in the trap | What it usually indicates | Question to ask the agency |
|---|---|---|
| Scorecard never mentions baseline demand | All attributed conversions are credited to media | What share of these conversions would have happened without the ad? |
| Bonus or renewal tied to a ROAS or CPA threshold | Agency incentive points at the cheapest attributable conversion | Which channels contribute most to hitting the threshold, and why? |
| Quarterly review with no control group or model | Effectiveness has never been tested, only assumed | What test would you propose to isolate incremental impact? |
| CPA falls while new-customer volume in the ledger is flat | Budget may be shifting toward existing intent | Show branded search and retargeting share of conversions over time |
| Weekly and quarterly decks use the same metrics | Cadence has collapsed effectiveness into efficiency | What would you report if the dashboards were unavailable? |
The signals are GPI's diagnostic reasoning built on Ipsos MMA's description of dashboard-driven reporting; they are patterns to check, not survey findings. Audit the last three agency reviews against this table.
We'll explain more below.
Why platform dashboards pull reporting toward efficiency
Ipsos MMA describes how ROAS, CPC and CPA:
- Are generated automatically and at high frequency.
- Need no additional methodology.
- Arrive specific and granular.
- Are simple to hand upward to leadership.
Effectiveness figures require a baseline, a model or a test, and arrive quarterly with a confidence range attached. Given the two, a busy leadership team reaches for the one already on the screen.
The same accessibility shapes agency behavior.
Whatever the contract says about growth, the metric the client sees fastest becomes the metric the agency defends hardest, because that is the number that comes up in every status call. Over a year, the account team learns which figures end conversations well and optimizes toward them.
Reporting cadence rewards what arrives weekly
A weekly review can only discuss what has been updated since last week. That excludes incremental contribution by construction, since no credible incrementality reading changes in seven days.
So the weekly meeting becomes an efficiency meeting, and the quarterly meeting inherits the weekly meeting's vocabulary because the same slides get rolled up. The result is an organization that has never formally decided to prioritize efficiency and yet does so in every forum.
The cost compounds. Efficiency, as the CMSWire piece notes, can either accelerate a good thing or exacerbate a bad one. A brand with weak retention that gets more efficient at acquisition is filling a leaking bucket faster, and the acquisition dashboard will celebrate it.
How retainers and bonuses reinforce efficiency metrics
When a bonus is triggered by a ROAS threshold, the agency's finance director is now also optimizing for the dashboard. Contract mechanics are the subject of a later section; here the point is diagnostic.
If none of the last three performance reviews included a number from outside a platform dashboard, the organization is in the trap regardless of what the strategy document says.
How Efficiency Targets Inflate Results: Baseline, Cannibalization and Creative
Baseline demand gets counted as performance
Efficiency metrics inflate results through three mechanisms, and the first is the largest. Ipsos MMA sets out the core requirement of effectiveness measurement: isolate the outcomes marketing caused from what would have happened without it.
For an established brand, baseline demand can be the majority of total sales. Platform attribution does not know this. It assigns every tracked conversion to the last ad or click that touched it, so a customer who searched for the brand by name after years of loyalty is recorded as a paid-search win. The larger the baseline, the more the platform overstates what media did.
Branded search and retargeting: the cheapest conversions are often the least incremental
The second mechanism is a conceptual argument rather than a cited statistic, and it follows from the first. Channels that intercept existing intent show the best CPA precisely because they capture buyers who were already on their way.
Branded search sits in front of a person who typed the brand's name. Retargeting reaches someone who visited the site this week. Both convert cheaply because much of the conversion was going to occur anyway.
An agency rewarded on blended CPA or ROAS therefore has a rational incentive to move budget toward those channels.
Consider a hypothetical program that shifts 20% of spend from cold prospecting into branded search and retargeting. The report will show a lower blended CPA and a higher ROAS. The finance ledger will show new-customer growth roughly unchanged, because the extra branded conversions were mostly people the brand already had.
The report looks like an efficiency improvement; incremental contribution has fallen or stayed flat. This is cannibalization, and the platform figures cannot reveal it because the platform never sees the counterfactual.
To avoid this, ask the agency:
- What share of last quarter's attributed conversions came from branded search and retargeting.
- How that share has moved over time.
- What evidence exists about what those users would have done without the ad.
Creative quality is the largest lever efficiency metrics ignore
The third mechanism is an omission. In Circana's meta-analysis of CPG campaigns across digital and TV, published in 2023, advertising creative drove nearly half of incremental sales, at 49%, ahead of brand, targeting, reach and recency.
If creative is the largest single driver of effectiveness, an incentive built on media delivery gives the agency very little reason to invest in it. Creative testing costs money and time, does not improve CPA on day one, and is easy to defer when the bonus depends on this month's ROAS.
The limitation matters.
Circana's figure comes from CPG campaigns and from 2023; B2B and long-cycle businesses should read it as directional evidence that creative deserves more weight than targeting efficiency. It's not a a universal ratio, so:
- It cannot tell a software company what share of its pipeline depends on creative.
- It can tell a buyer that a scorecard with no creative measure is missing the lever the best available evidence says is biggest.
Taken together, the three mechanisms produce a program that is genuinely cheaper per attributed conversion and genuinely worse for growth. Both are true at once, which is why the definitions section insisted that efficiency and effectiveness can move in opposite directions.
Aligning Finance and Marketing on Incrementality (and Defending a Higher CAC)
The finance conversation has to precede any contract change, because an agency cannot be held to a standard the client has not agreed with its own CFO. We explain exactly how to do that below.
Agree what counts as incremental before the numbers arrive
The PwC figure from the introduction gives the context: the share of CMOs strongly agreeing that decision-makers understand marketing's value fell from 54% in 2023 to 40% in the June 2024 survey. The survey measures perception, so it cannot show exact causes. However, the gap between platform-reported revenue and ledger-verified revenue is one plausible contributor, and it is the one a CMO can close.
The method is the one Ipsos MMA describes: measure what marketing caused, separate from what would have happened without it. The timing is the part organizations get wrong. Agree the baseline method, the window and the evidence standard before the quarter, so that the result cannot be negotiated after it arrives.
Why reported CAC rises when you stop counting baseline
The CFO should expect one number to move. Incremental CAC divides the same spend by fewer customers, because customers who would have converted anyway are no longer credited to media. Spend is unchanged, the denominator shrinks, the ratio rises.
Let's take this example: a platform reports 1,000 attributed new customers on $50,000 of spend, a $50 CPA. A holdout suggests 40% of those customers would have converted without the ads. Incremental customers are 600, and incremental CAC is roughly $83 on identical spend.
Nothing about the program's performance changed between the two lines. The first line overstated the count. Framed this way, the higher CAC is a correction to an inflated figure, and the CFO is likely to prefer it, because it reconciles with revenue finance can see.
Three evidence tiers finance will accept
Not every business can run every test, so agree on a hierarchy. The order below is GPI's conceptual ranking that you can use.
- Geographic or audience holdouts, where a matched group receives no media, are the strongest evidence because they create the counterfactual directly.
- Marketing mix or regression models with stated confidence ranges are next; they infer contribution statistically and must disclose their uncertainty.
- Platform lift studies are the weakest of the three, since the platform is grading its own work, but they still beat last-click attribution, which has no counterfactual at all.
A one-page reconciliation between platform ROAS and ledger revenue
The document that moves finance is short. It puts the platform view and the incremental view side by side and lists every assumption as an assumption.
| Line | Platform-attributed view | Incremental view | Assumption that must be documented |
|---|---|---|---|
| Revenue credited to paid media | All conversions with a tracked touch | Attributed revenue minus estimated baseline | Which channels are treated as intercepting existing intent |
| Estimated baseline | Not shown | Share of conversions that would occur without media | Source of the estimate: holdout, model or lift study |
| New customers credited | All attributed | Attributed minus baseline share | Definition of new versus returning in the ledger |
| Spend | Media plus fees | Media plus fees, unchanged | Fee allocation across channels |
| CAC | Spend divided by attributed customers | Spend divided by incremental customers | Confidence range on the baseline estimate |
The format is GPI's suggested structure; the underlying requirement to net out baseline follows Ipsos MMA's definition of incremental impact.
- DTC businesses reconcile against orders and repeat rate over weeks.
- B2B businesses reconcile against qualified pipeline and closed-won with a lag of months, so the holdout window is longer and the acceptable confidence range is wider.
Draft the page for last quarter and take it to finance with the assumptions marked as such.
For a fuller method on tying agency reporting back to profit rather than platform metrics, see GPI's guide to evaluating marketing agency performance by profit.
Restructuring Agency Incentives and KPIs to Reward Effectiveness
Currently, most agency contracts pay for delivery, not growth. That's why you need effectiveness KPIs; you also need to enforce efficiency as a guardrail, but not as the end goal.
Five compensation structures and what each one actually rewards
The table compares five structures as conceptual frameworks. No row describes a specific agency or client result. But you can see what each compensation structure actually rewards, its gaming risk, the evidence you need instead and a better fit.
| Compensation structure | What it actually rewards | Gaming risk | Evidence the client needs | Best fit |
|---|---|---|---|---|
| Percentage of media spend | Budget growth | High: incentive to recommend more spend | Independent view of marginal return | Large, stable budgets with strong internal analytics |
| Flat retainer | Account retention and scope delivery | Medium: incentive toward reassuring reports | Clear scope and output definitions | Early relationships and strategy-heavy work |
| Platform-metric bonus (ROAS or CPA) | Cheapest attributed conversion | High: budget drifts toward existing intent | Channel mix disclosure over time | Short-cycle DTC with genuinely new audiences |
| Incremental-contribution bonus | Verified lift over baseline | Low on outcome, medium on measurement disputes | Agreed holdout, model or lift standard | Businesses able to run holdouts or fund modeling |
| Hybrid retainer plus incrementality bonus | Stable delivery plus verified lift | Low to medium | Same as above plus fee split rationale | Most mid-to-large programs during transition |
The gaming and evidence columns extend Ipsos MMA's output versus outcome distinction into contract design; they are GPI's analysis rather than survey data. A hypothetical hybrid might place 80% of the fee as fixed retainer and 20% at risk against an incremental revenue target measured by geo holdout, with a CPA ceiling as a guardrail. The proportions are illustrative and should follow budget size and measurement confidence.
How to write effectiveness KPIs: baseline, window, evidence standard and dispute path
An effectiveness KPI that can actually be enforced needs four elements:
- The baseline method: how the counterfactual is estimated, following the requirement to separate incremental impact from baseline.
- The measurement window, matched to the sales cycle so that a B2B program is not judged on a 30-day lag.
- The evidence standard, naming which tier from the finance section counts: holdout, model or lift study.
- The dispute path, naming who arbitrates when the agency and client disagree about a reading, whether an internal analytics lead, a third-party measurement vendor or a pre-agreed rule for splitting the difference.
A clause missing any of the four will be argued about at the first bonus date.
Use marketing efficiency metrics as guardrails
Efficiency metrics do not disappear from the contract. They move from target to boundary. A maximum CPA ceiling prevents runaway spend; a minimum ROAS floor catches a program that has lost control of delivery. Neither makes cheapness the point. The bonus attaches to incremental contribution, and the guardrails define the space within which the agency pursues it.
Creative deserves a line of its own.
Because creative is the largest effectiveness driver in the evidence available, at 49% of incremental sales in Circana's 2023 CPG meta-analysis, a contract that measures only media delivery ignores the biggest lever.
For a media agency that does not produce creative, the KPI can be testing velocity: number of concepts tested per quarter, share of spend on variants less than a set number of weeks old, or documented creative lift where the platform supports it.
A 90-day transition plan that does not blow up the relationship
Moving from delivery pay to contribution pay in one renewal invites a breakdown. A sequenced transition works better.
- Days 1 to 30: run parallel reporting. Keep the existing dashboard scorecard and add the one-page reconciliation beside it, so both parties see the gap without money attached.
- Days 31 to 60: jointly define the baseline method and window, and write the four-element clause as a draft. Agree the dispute path now, while nobody is disputing anything.
- Days 61 to 90: attach a small at-risk share, perhaps a tenth of the fee as an illustrative starting point, to the incrementality reading for the following quarter.
- Following renewals: scale the at-risk share as measurement confidence grows and the reconciliation stabilizes.
Expect pushback and sort it by kind. Concerns about measurement noise and small budgets are legitimate and should shape the window and the confidence range. A refusal to run any holdout at all, or an insistence that only platform figures count, is protective rather than technical. This tells you what the agency expects a holdout to show. Rewrite one KPI in the current agreement using the four elements and share it as a draft before the next renewal.
Where Channel Efficiency Still Belongs
In-flight optimization is the agency's job; effectiveness is the buyer's question
None of this argues against efficiency itself. Bids, placements, audiences and dayparts change hourly, and the only feedback fast enough to steer them is the platform's own cost-per-output data.
Ipsos MMA's definition of efficiency as budget spent per unit of output describes exactly the tool an operator needs for those decisions.
The boundary sits where the decision changes.
Adjusting a bid is tactical and belongs to the agency. Deciding how much budget each channel deserves, or whether the agency should be renewed, is allocation and evaluation. Those decisions need effectiveness evidence because they concern what the money caused.
B2B pipeline vs DTC lifetime value: same principle, different measurement windows
The principle that effectiveness is behavior change rather than delivery, drawn from Vectoron's healthcare framing, holds across sectors.
What differs is the observable behavior and its timing.
- For DTC, the behavior is a first purchase and then a repeat, visible in weeks, so lifetime value can be estimated within a quarter or two.
- For B2B, the behavior is a qualified opportunity and a closed-won deal, visible over months, so the effectiveness window stretches and pipeline stages stand in for revenue until deals close.
Neither business type escapes the efficiency trap; each needs its own window.
Review cadence: weekly efficiency checks versus quarterly effectiveness deep-dives
The practical fix is a split calendar. Hold a weekly efficiency check with the agency team on platform data and in-flight adjustments. Hold a quarterly effectiveness review with finance in the room, working from the reconciliation page and the agreed baseline.
Keeping the two meetings separate stops the weekly vocabulary from swallowing the quarterly one.
How GPI Assesses Whether a Partner Delivers Effectiveness, Not Just Efficient Dashboards
The decision is simple to state. Pay for efficiency and you get efficiency: falling CPA, rising ROAS and a finance ledger that does not move with them. Pay for verified incremental contribution and you get effectiveness, reported at a higher and more honest CAC.
GPI's assessment of agency partners follows the same logic. The Growth Partner Confidence Score methodology explains how documented evidence, stated methodology and acknowledged limitations are weighed when assessing agency claims, and why headline metrics without that support carry less weight.
Questions to ask any agency before you sign
Run these against a shortlisted or incumbent agency and note which answers arrive with evidence.
- Do you separate baseline demand from incremental conversions in your reporting, and how? This follows the requirement Ipsos MMA describes to measure what marketing caused apart from what would have happened anyway.
- Will you accept geo or audience holdouts, and what window and budget would you need to make one readable?
- Do you report creative contribution, or only media delivery?
- Which of your channels intercept existing intent, and how has their share of conversions moved over the past year?
- What would you show us if the platform dashboards were unavailable for a quarter?
What documented evidence should look like
A pitch that leads with a tripled ROAS and cannot say what baseline it was measured against fails the first question. Evidence that passes looks different: a stated method, a named counterfactual, a confidence range and a limitation the agency volunteers rather than concedes.
An agency that is proud of being efficient at metrics that do not move the bottom line is describing the exact failure mode the CMSWire contributors warned about.
GPI's agency evaluation guidance, referenced earlier in the finance section, is a reasonable companion for the next review cycle.
Frequently Asked Questions
Our media budget is too small for a clean geo holdout. What evidence of incrementality can we reasonably ask an agency for instead?
A small budget makes a holdout statistically weak, so treat this as conceptual guidance rather than a test standard. Ask for a channel mix disclosure showing branded search and retargeting share over time, a platform lift study where available, and a simple pre-and-post comparison against a period with spend paused in one channel. None of these is proof, but together they are far more informative than last-click attribution, and they establish the habit of asking about the counterfactual.
How much of an agency's fee should sit at risk against incremental contribution during the first year of a new structure?
There is no sourced benchmark, so this is judgement. Start small enough that a noisy first reading does not damage the relationship, perhaps a tenth of the fee as an illustrative figure, and tie the increase to measurement confidence rather than to the calendar. The at-risk share should grow when the baseline method has produced two or three consistent readings, not before. A large at-risk share against an untested method invites disputes about measurement instead of conversations about growth.
The agency says removing baseline conversions from its credit is unfair because brand demand exists partly because of past media. How should we handle that argument?
The argument is partly correct and should be acknowledged. Past media does contribute to baseline demand. The answer is that the contract pays for this period's incremental contribution, and past contribution was paid for in past periods. Baseline is a measurement construct, as Ipsos MMA's framing makes clear, not a moral judgement. If the agency wants credit for brand building, write a brand metric into the KPI with its own window.
Should efficiency guardrails like a maximum CPA sit in the contract or in a separate operating agreement that can change quarterly?
Put the principle in the contract and the number in an operating schedule. The contract states that efficiency guardrails exist, that they are boundaries rather than targets, and how they are revised. The schedule holds the current CPA ceiling and ROAS floor, reviewed quarterly by both parties. Seasonality, new markets and creative launches all move sensible ceilings, and forcing a contract amendment each time either freezes the guardrail or trains everyone to ignore it.
How do we set the measurement window for an effectiveness KPI when B2B deals take six to nine months to close?
Use staged windows. Measure incremental qualified pipeline over a window that matches the time from first touch to qualification, and measure closed-won contribution over the full cycle with a lag. Pay a portion of the incentive on pipeline and hold a portion until closed-won data arrives. Agree conversion assumptions from pipeline to revenue in advance and revisit them annually, so that neither party can revise them after the fact to change a reading.
If creative is the largest effectiveness driver, what creative KPI can be written into a media agency contract without punishing them for a creative team they do not control?
Measure what the media agency does control. Circana's 2023 CPG meta-analysis found creative drove 49% of incremental sales, which argues for a creative KPI, but a media agency cannot be judged on concepts it did not make. Write the KPI around testing discipline: number of creative variants tested per quarter, share of spend behind variants below an agreed age, and documented reporting of creative performance back to whoever owns production. That rewards the agency for making creative quality visible.
