

Most media teams have sat through the meeting where a platform dashboard reports a strong return on a channel and a holdout test reports almost none, and the room spends an hour deciding which number is lying. Neither is. They answer different questions, and the argument over which to trust is a symptom of never deciding which question the budget decision actually needs answered. Nielsen's 2025 Marketing ROI Blueprint found that 85% of marketers feel confident tracking holistic performance while only 32% actually measure holistically, a self-reported gap that helps explain why contradictory numbers arrive as surprises rather than expected inputs. This article argues that incrementality vs attribution is a false contest, lays out a time-horizon architecture in which lift results recalibrate the attribution signals used for daily optimization, and sets out what to require from an agency that will operate that loop.
The incrementality versus attribution argument survives because it lets teams avoid a harder question: what decision is this number supposed to inform? Attribution records which touchpoints were present when someone converted. Incrementality estimates what would have happened had the spend not run. Presence is the right input for adjusting bids on a Tuesday. A counterfactual is the right input for deciding whether a channel keeps its budget next quarter. Budgets go wrong when either number is treated as proof of causation for the other's decision. Our position at Growth Partner Index is that measurement should be chosen per decision, that lift results should discount attribution rather than replace it, and that an agency claiming its dashboard already settles causation should be asked for the evidence, the method and its limits.
TL;DR
- Attribution reports which touchpoints were present on a conversion path. Incrementality estimates how conversions would change if spend changed. Each is precise about its own question and blind to the other's, so neither can replace the other.
- Platform attribution over-credits clickable, measurable media and under-credits demand creation, which is why budgets run on last-touch numbers drift toward harvesting demand that already existed.
- Signal loss and privacy regulation have thinned user-level tracking, so causal tests and modeled approaches are now necessary complements, not optional upgrades.
- The workable architecture gives attribution the daily optimization job, lift tests the periodic recalibration job and marketing mix modeling the annual planning job, with written rules for how each layer feeds the next.
- Most marketers say they measure holistically and far fewer do, which means the organizational fight over contradictory numbers is the real obstacle rather than the math.
- Agency evaluation should test whether a partner can document this loop, including what it did the last time a lift test contradicted its own dashboard.
Check whether your current stack assigns distinct roles to attribution and lift at all. A brand whose Meta dashboard and geo holdout disagree by a wide margin usually has a role problem, not a vendor problem.

Attribution and Incrementality Answer Different Questions
Attribution and incrementality measure different things, so asking which is more accurate is like asking whether a thermometer or a barometer is more accurate. The useful question is which one your next allocation decision needs.
What attribution can actually tell you
Attribution is a presence record. It lists which touchpoints appeared on the path to a conversion and assigns credit among them according to a rule: last click, linear, data-driven or whatever the platform or vendor applies. Circana puts the distinction plainly: attribution tells you which touchpoints were present when a conversion happened, while incremental attribution tells you which of them actually caused it. That presence record is useful. It arrives quickly, it is granular to the ad, audience and creative, and it moves when you change something. What it does not contain is any information about the conversions that would have happened anyway.
What incrementality can actually tell you
Incrementality asks the counterfactual. Haus frames it as the difference between knowing where activity happens and how it correlates with conversions, versus knowing what would truly change if you changed spend or tactics. The estimate comes from comparing an exposed group to a withheld one, whether by geography, audience or time. It is slower, coarser and expensive to repeat, and it says little about which creative or audience within the channel did the work. It is the only one of the two methods that speaks to cause.
Where the two are routinely confused
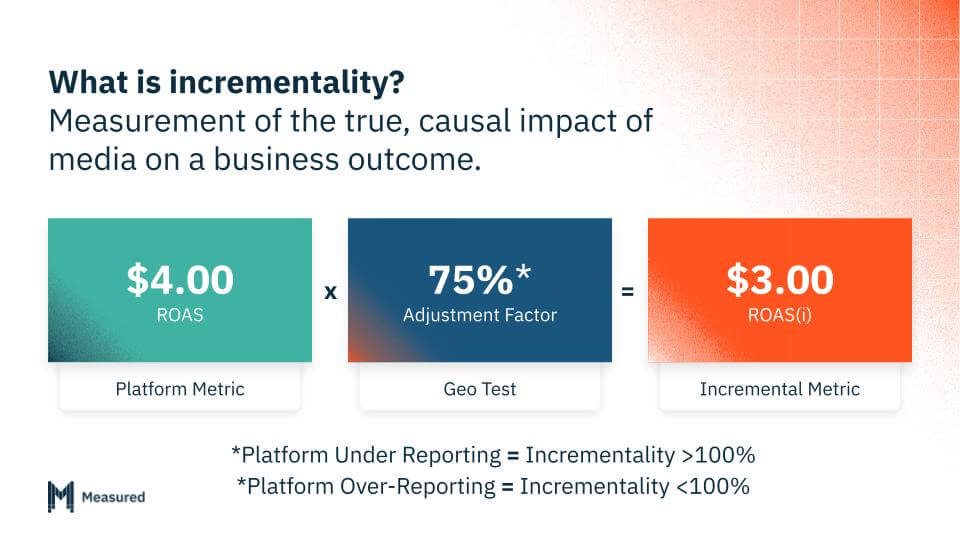
The confusion has a mechanical origin: both methods emit a number labeled ROAS. Reported ROAS from a platform is attributed revenue over spend. Incremental ROAS, or iROAS, is the counterfactual lift in revenue over spend. Teams then compare a correlative unit with a causal one as if they were the same currency, and the resulting gap gets treated as an error to be litigated rather than as information about how much of the attributed volume was already going to convert.
| Dimension | Attribution | Incrementality |
|---|---|---|
| Question answered | Which touchpoints were present when the conversion happened? | What would have happened to conversions without this spend? |
| Unit produced | Attributed conversions and reported ROAS | Incremental conversions and iROAS |
| Time horizon | Immediate, refreshed daily or faster | Weeks to months per reading |
| Characteristic failure mode | Crediting conversions that would have occurred anyway | Too coarse and too slow to guide bids, creative or audience choices |
The question and unit rows draw on Circana's presence-versus-cause framing and Haus's counterfactual definition linked above; the horizon and failure-mode rows are the standard characterization used by vendors such as incrmntal and Skai in their explainers.
A practical habit follows. Before the next allocation meeting, write the decision down as a sentence and label it either presence or counterfactual. If the sentence is about which ad set to shift budget toward this week, you need a presence number. If it is about whether the channel deserves its envelope next quarter, you need a counterfactual, and the dashboard cannot supply it no matter how well configured.
Why Platform Attribution Overstates the Channels You Can Click
Platform-reported attribution is not randomly noisy. It is biased in a predictable direction, and knowing the direction is what makes the number usable.

Measurable clicks get the credit
Measured's summary of the problem is that multi-touch attribution now paints an incomplete picture because it tends to over-credit measurable clicks and under-credit media that builds awareness or converts indirectly. The mechanism is simple. A click leaves a trace that can be joined to a conversion; an impression that shaped a preference two weeks earlier often leaves nothing joinable. Attribution can only distribute credit among the touchpoints it can see, so the visible, clickable ones absorb the credit whether or not they caused anything.
Each platform also scores its own contribution on its own attribution window and its own view of the path. A channel-reported ROAS is therefore a claim, and a reasonable one to check, rather than a settled fact about what the channel produced.
Demand creation gets the blame
The mirror image is that channels whose job is to create demand look weak in the same reports. Video, audio, out-of-home and upper-funnel social tend to appear early on paths that end in a branded search click or a retargeting click, so the credit flows downstream. Circana's write-up on what incrementality attribution reveals makes the same point from the other side: presence on the path does not establish who caused the conversion, and the touchpoints most likely to be present at the end are the ones that catch demand rather than build it.
The budget drift this produces
Run allocation on last-touch numbers for a few quarters and the pattern is predictable. Branded search, retargeting and lower-funnel social report the highest returns, so they receive more budget. Their reported returns hold up because the demand they harvest is still arriving from the channels being cut. Eventually the pool of existing demand shrinks, reported efficiency falls everywhere at once and no line item explains why. GPI's guide to scaling paid media when spend stops producing growth covers what that plateau looks like from the buyer's side.
This is a mechanism problem rather than a vendor honesty problem, which is why switching attribution vendors rarely changes the drift. The practical response is to list the channels where your reported ROAS is highest and treat them as the first candidates for a holdout. That is where the gap between reported and incremental return is most likely to be largest, precisely because attribution is most confident there. No approved evidence in our ledger quantifies a typical gap, so treat the size as unknown until your own test reads it.
Signal Loss Did Not Settle the Debate, It Dissolved It
A few years ago it was at least coherent to argue that a well-instrumented attribution stack could carry most of the measurement load. The data environment has since removed that option, which is why the debate dissolved rather than being won.
What privacy regulation and signal loss removed
The IAB's State of Data 2026 report describes the current situation as one where privacy regulation, signal loss, platform-embedded optimization and fragmented data environments have made it harder to connect media exposure to outcomes with confidence. User-level attribution depends on identifiers that persist across an ad exposure and a later conversion. As those identifiers become less available, the share of paths attribution can observe shrinks, even where its logic remains sound. Coverage falls before accuracy does, and a partial path record is a worse basis for allocation than a complete one.
Platform-embedded optimization compounds this. The platform that bids on your behalf is also the platform that reports what the bidding achieved. Nothing sinister follows from that, but the scorekeeper and the player share an interest, and that raises the value of independent validation.
Why modeled and experimental methods filled the gap
Causal tests at the geography or audience level do not need to know who any individual is. They compare aggregate outcomes in exposed and withheld groups, which is why they gained ground as the identifier-based methods lost coverage. Modeled approaches such as marketing mix modeling similarly work from aggregate spend and outcome series rather than user paths. The IAB has gone as far as publishing guidelines for incremental measurement in commerce media, a sign that the industry body treats incremental methods as standard infrastructure rather than an advanced option.
None of this makes attribution obsolete. It remains the only signal that refreshes fast enough and granularly enough to run optimization. What changed is that relying on it alone stopped being a defensible choice. Teams still arguing attribution versus incrementality are debating a menu the environment no longer offers. A useful first step is to audit which of your attribution paths still depend on user-level identifiers and mark those channels for geo or audience-level validation, because that is where the presence record is thinnest and the risk of misallocation highest.
A Time-Horizon Framework for Using Both
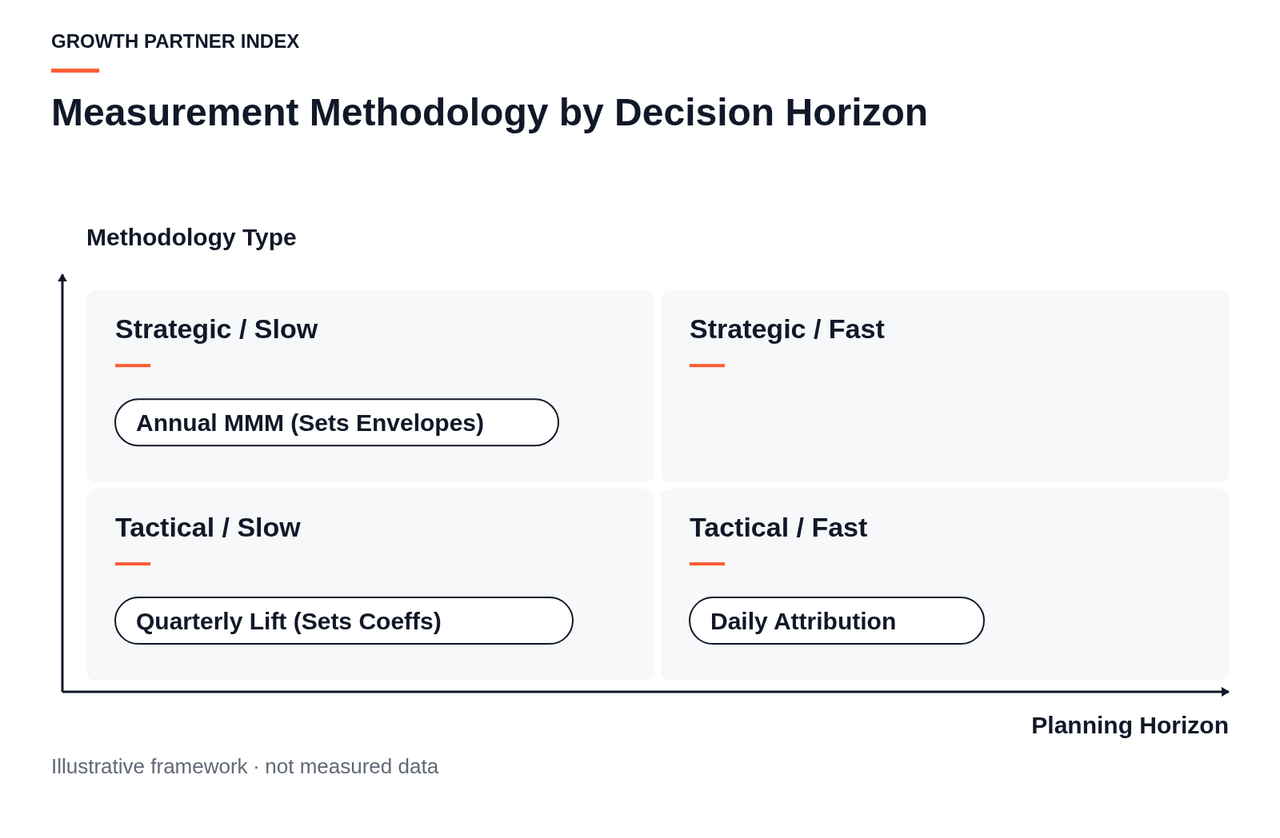
The framework that resolves the debate assigns each method to the decision horizon it fits, then specifies what each layer hands to the one below. Adjust's summary is the cleanest statement of the structure: attribution provides immediate insights, incrementality helps optimize mid-term strategies and MMM supports long-term strategic decisions. That framing comes from vendors and has not been validated as an empirical finding, so treat it as a defensible starting structure rather than a proven standard. It is still the most useful way we know to end the argument.
Daily and weekly: attribution runs optimization
Bid changes, creative rotation, audience exclusions and pacing adjustments happen daily or faster. Only attribution refreshes at that cadence. A lift test cannot tell you which of three creatives to pause on Wednesday, and asking it to is the mirror-image error of asking a dashboard to prove causation. The daily layer's job is to allocate efficiently within the envelope and coefficients it has been given, using the presence signal for what it is good at: relative comparisons between ads, audiences and placements inside one channel.
Monthly and quarterly: lift tests recalibrate
The mid-term layer answers whether a channel earns its budget and by how much its attributed signal should be discounted. This is where holdouts and geo experiments belong. Their output is a coefficient per channel, the ratio of incremental to attributed outcomes, plus a decision about the channel envelope for the next period. Haus's counterfactual framing applies here: the question is what would change if spend changed, not where activity was present. Measured's decision tree for choosing between incrementality, attribution and MMM organizes the choice the same way, around the decision being made rather than the method's prestige.
Annual: MMM sets the envelope
Marketing mix modeling works from aggregate spend and outcome data over long periods, which makes it suited to setting channel envelopes, estimating diminishing returns and planning the mix for a year. It is too slow and too coarse to run either of the layers below it. Its output is the set of envelopes the mid-term layer works within and the priors that help interpret lift results when a test comes back noisy.
| Time horizon | Decision being made | Primary method | What it hands to the next layer | Typical cadence |
|---|---|---|---|---|
| Annual | Channel envelopes, mix, diminishing-return curves | Marketing mix modeling | Envelopes and priors for the mid-term layer | Once or twice a year, refreshed as data allows |
| Monthly to quarterly | Whether each channel earns its envelope and how far to discount its attributed signal | Lift tests, geo or audience holdouts | Per-channel coefficients with expiry dates for the daily layer | Rolling program, one or a few channels per quarter |
| Daily to weekly | Bids, creative, audiences, pacing within a channel | Attribution, discounted by coefficients | Performance and spend data back up to the test and modeling layers | Continuous |
The horizon-to-method mapping follows Adjust's framework linked above; the hand-off column is GPI's extension of that framework into an operating model and should be read as a proposal rather than a documented industry standard. Cassandra's budget decision framework organizes the same choice around the budget decision at hand.
The hand-offs are what make this an architecture rather than three separate reports. MMM sets envelopes. Lift tests set coefficients within those envelopes. Attribution allocates within the coefficients. Data from daily operation flows back up to feed the next round of tests and the next model refresh. Each layer is authoritative for its own decision and advisory for the others.
A useful exercise is to list every recurring budget meeting on the calendar and map each one to a single horizon and a single primary method. Most teams find at least one meeting where a quarterly envelope question is being decided on last week's dashboard, or where a daily pacing question is stalled waiting for a test result. Those are the meetings where the wrong number is in the room.
How Lift Results Should Recalibrate Attribution in Daily Bidding
Connect the daily and mid-term layers with an explicit loop. Run a lift test, express the result as a ratio against the attributed number, apply that ratio to the signal the bidding team actually uses, and put an expiry date on it. A practitioner in the r/analytics thread on this topic describes the same logic informally: attribution is calibrated through lift studies and then used for optimization, because lift studies cannot run at short-term cadence. What follows turns that practice into a written procedure. It is a conceptual process built from practitioner experience, not a validated standard, and the mechanics of designing the test itself are covered in GPI's guide to what to require from an agency before committing to incrementality testing.
- Choose the channel where the counterfactual is most uncertain and attribution is most confident. High reported ROAS is the signal to look for. Branded search, retargeting and lower-funnel social are the usual candidates because that is where presence and cause most often diverge. Set the test window, the holdout structure and the spend level to be tested before anything runs.
- Express the result as a ratio of incremental to attributed conversions over the test window. This is the coefficient. Hypothetical example for illustration only: if the platform attributed 1,000 conversions to the channel during the window and the holdout implies 400 of those would not have happened without the spend, the coefficient is 0.4. Record the confidence interval alongside it; a coefficient of 0.4 with an interval from 0.2 to 0.6 should be handled differently from one with an interval from 0.35 to 0.45.
- Apply the coefficient to the attributed signal used in bidding targets and pacing, with an expiry date. In the hypothetical above, a bidding target of a 4.0 reported ROAS becomes a target that implies roughly 1.6 in incremental terms, so either the target is raised or the pacing is lowered until the incremental return clears the threshold the channel needs to meet. Write the expiry date into the same document. A coefficient with no expiry becomes folklore.
- Re-test when conditions leave the range the test covered. The coefficient is conditional on the spend level, creative mix and seasonality that prevailed during the test. Meaningful changes to any of them, or reaching the expiry date, trigger a new test. Until it reads, the old coefficient stays in force with its date visibly flagged.
Document every coefficient in one place with its channel, its value, its interval, the test it came from, the conditions it was measured under and its expiry. Channel managers then optimize against a corrected number they can see the provenance of, rather than an unexplained override from finance. This matters for morale as much as for accuracy. An override reads as distrust; a documented coefficient reads as shared method.
The daily layer also has downstream consumers. Creative and performance agencies such as Best Practice Media work from the same attribution signals when deciding which concepts to iterate, so the discounted number, not the raw platform figure, should be the one they are briefed against. GPI has no view on any result such an agency has achieved; the point is that whoever consumes the attribution signal should consume the calibrated version.
One commitment makes the loop real. Pick one high-ROAS channel now, set a date for its lift test and write down in advance how a result above or below a stated threshold will change its bidding target. Doing this before the result exists is what separates recalibration from post-hoc negotiation.
When the Lift Test Contradicts the Dashboard
The loop above fails most often at the moment the test result arrives, and it fails for organizational rather than technical reasons.
Why the fight is predictable
Confidence outruns execution. Per the same Nielsen report cited in the introduction, 85% of marketers say they are confident tracking holistic performance while 32% actually measure holistically. Those are self-reported figures from a 2025 survey and describe sentiment rather than audited maturity, but the gap they describe is the backdrop for what happens when a holdout contradicts a dashboard. A team that believes it already measures holistically has no expectation of contradiction, so the result lands as an accusation rather than as an input the architecture was designed to produce.
Add incentives and the dispute becomes rational. A channel manager whose bonus, headcount or standing rests on attributed ROAS has every reason to question the test's design, its window and its sample. Treat this as a design flaw in how performance is measured, not as bad faith. People defend the number they are judged on.
Pre-agreeing the decision rule
The fix is to agree the decision rule before the test runs. A one-page document should name the trigger thresholds, the budget consequence attached to each and the person who owns the call when the numbers disagree. A workable structure: if the coefficient reads above an agreed level, the envelope holds or grows; within a middle band, the coefficient is applied and the envelope holds; below a floor, the envelope is cut by a stated amount pending a re-test. When the rule exists beforehand, the argument after the result is about whether the test was executed as designed, which is a narrow and answerable question. Without the rule, every result becomes a negotiation about what it means.
Finance, analytics and media also need a shared definition of which number is authoritative at which horizon. Media owns the attributed number for daily allocation. Analytics owns the coefficient and its expiry. Finance owns the envelope. Writing this down removes the standing ambiguity that lets each function reach for the number that flatters it.
Separating the channel manager's performance from the channel's
Evaluate people on incremental contribution within the envelope they were given, not on attributed volume they can inflate by harvesting demand. A manager who runs branded search efficiently inside a discounted target has done a good job even if the channel's coefficient is low. A manager who grows attributed conversions by widening retargeting audiences has done a worse job than the dashboard suggests. Once compensation and review are tied to the calibrated number, the rational incentive to dispute lift results weakens, and the loop can run without a fight each quarter.
Does the Same Architecture Hold for B2B and DTC?
The architecture holds across sectors, but the weight on each layer shifts with cycle length and conversion density.
Where DTC ecommerce can lean on faster lift signals
A DTC brand with short purchase cycles and dense conversion volume can read a geo holdout in weeks. That cadence keeps coefficients current, so the mid-term layer runs on frequent experiments and the daily layer is rarely working from a stale discount. Haus's 2025 State of Growth Marketing in DTC and Ecommerce surveys how these teams approach growth measurement, and the counterfactual framing from the same company applies directly: the question of what would change if spend changed can be asked and answered often enough to matter operationally.
Where long B2B cycles shift weight toward modeled and directional methods
B2B teams face long opportunity-to-close windows, low conversion volume and closes that happen offline in a CRM. A holdout on a channel whose effect appears in pipeline six months later takes longer to read than most planning cycles allow, and the attribution paths are sparser because fewer touchpoints are joinable to a closed deal. The layered logic still holds, but the mid-term layer leans more on pipeline-stage validation, leading indicators such as qualified opportunities rather than revenue, and modeled approaches that can work from aggregate series. Coefficients will have wider intervals and longer expiry dates, and that should be stated openly rather than hidden.
The shared failure mode: mistaking presence for causation
In both sectors the failure is identical. The presence metric is the only number available weekly, so it quietly becomes the causal one because nothing else is in the room when decisions get made. The DTC version is a retargeting line that keeps growing on attributed ROAS. The B2B version is a paid search program credited with pipeline that inbound demand would have produced anyway. The remedy is the same: identify the horizon where your sector makes the framework hardest to run, decide in advance which substitute signal you will accept there and label it as a substitute. No approved evidence quantifies how sector differences change the size of the gap, so the guidance here is directional.
How GPI Evaluates Agencies on Measurement Architecture
GPI does not run campaigns and does not vouch for any agency's results. What we do is assess agency claims against their evidence, methodology and limitations, and the measurement loop described above turns out to be a sharp test of whether a paid media partner can do the same.
Questions that reveal whether the loop exists
Two questions do most of the work in an RFP or review meeting. First, ask the agency to describe a case where a lift test contradicted its own dashboard and to walk through what changed in bidding as a result. A partner that runs the loop will have a specific example with a coefficient, a date and a budget consequence. A partner that describes the concept in general terms is telling you the loop exists on a slide.
Second, ask how attributed ROAS is discounted per channel today, who set each coefficient and when it expires. An agency operating the architecture can answer in a sentence. If it cannot, that tells you more than any confidence it projects about its measurement stack.
Score the responses on documentation rather than fluency. Given that only a minority of marketers report actually measuring holistically, an agency that can operate the layered loop is differentiated, and buyers should verify that capability rather than assume it from a well-designed pitch.
Reading agency evidence rather than agency claims
GPI's Growth Partner Confidence Score methodology is built on the principle that a claim is evaluated against the evidence and method behind it, not against how it is presented. Apply the same standard to measurement narratives. Profiles of paid media agencies such as Admiral Media and Arda Media are places to check what measurement capability is documented before a shortlist conversation; GPI does not assert what those profiles conclude about any client outcome, and neither should you until the references confirm it.
Compare how paid media agencies profiled on Growth Partner Index, such as Avalaunch Media, document their measurement approach before you build a shortlist. The debate over incrementality vs attribution will not be settled by a vendor. It is settled inside a buyer's own architecture, and the agency you choose either operates that architecture or works around it.
FAQ
How long does a lift-derived attribution coefficient stay valid before it needs re-testing?
As long as the conditions it was measured under still hold. The coefficient is conditional on the spend level, creative mix and seasonality in the test window, so a material change to any of them ends its validity regardless of the calendar. Absent such a change, set an expiry when you record it and re-test at that date. No approved evidence in our ledger establishes a standard duration, so the expiry is a governance decision you make explicitly, then revisit as your own tests show how quickly coefficients drift.
Should the same lift result change bidding targets immediately or only at the next budget review?
Apply the coefficient to the bidding target as soon as the test reads cleanly, because the daily layer is the one it was designed to correct. Envelope changes wait for the budget review, since those belong to the mid-term and annual layers. Doing it in that order means the channel starts optimizing against a corrected number right away while the larger allocation decision is made with the full context of the other channels' results.
If a channel shows near-zero incrementality but strong attributed ROAS, do we cut it entirely or reduce it?
Reduce it in a way that produces another reading. Cutting to zero removes the ability to learn whether the coefficient changes at lower spend, which it often does for demand-harvesting channels. Step the envelope down to a level the decision rule specified in advance, re-test at the new level and let the result decide the next step. A near-zero reading with a wide interval also deserves a re-test before any large move.
How do we handle channels where a clean holdout is impractical, such as branded search or retargeting?
Use the least imperfect substitute and label it as such. Geo splits, time-based pauses in small markets or audience-level exclusions can produce a directional coefficient even where a textbook holdout is unavailable. Combine that with the MMM prior for the channel and set a shorter expiry to reflect the lower confidence. What you should not do is leave the attributed number undiscounted because a perfect test was unavailable; these are exactly the channels where presence and cause diverge most.
Who should own the authoritative number when media, finance and analytics disagree?
Ownership should be split by horizon, not held by one function. Media owns the attributed number for daily allocation. Analytics owns the coefficients and their expiry. Finance owns the envelopes. Disagreement then resolves to a question of which decision is being made, and the owner of that horizon has the call. Write this split down before the first contradictory result arrives.
What should an agency be able to show us to prove it runs this loop rather than just describing it?
A coefficient register with channels, values, intervals, test sources and expiry dates; a named example where a test contradicted the dashboard and bidding changed as a result; and a written decision rule from a past test showing the thresholds and consequences agreed in advance. If the agency can produce those three artifacts, it runs the loop. If it produces a framework diagram, it describes one.
