

Most guides on how to allocate a marketing budget hand you a percentage: split spend 70-20-10, hold marketing to a share of revenue, or divide the funnel into thirds. Those rules answer a question about what other companies did last year. They do not tell you where your next dollar earns a return, and that is the only allocation question a CMO or media director has to settle. The short answer this guide develops is to build the budget from the decisions it must inform, fund each channel until its verified marginal return reaches a stated threshold, size the testing reserve by what you can measure rather than a round number, and put agency retainers through the same evidence test as media. Finance and marketing then move money on one agreed cadence, with proof attached to every move.
GPI's view is that a budget is a stack of claims about where money will earn a return, and every claim deserves evidence. Percentage rules borrow peer averages; platform dashboards report correlation and label it return. Neither tells a media leader where to move the marginal dollar, which is the decision that changes outcomes when the total envelope is flat. So this guide funds channels to a verified threshold, sizes testing by measurement capacity, and treats agency fees as a spend line with its own return test. It costs more to run than a rule of thumb. The extra cost is worth paying when the spend at stake exceeds the cost of learning.
Why percentage rules cannot tell you how to allocate a marketing budget
Three heuristics dominate the ranking guides for this query. The HBS Online walkthrough frames budgeting around a set of strategic considerations, Planful and Improvado present allocation best practices and channel frameworks, and all three start from shares of a total. Each heuristic optimizes something, and each hides an assumption.
The 70-20-10 rule describes a shape, not a return
The 70-20-10 rule (70% proven channels, 20% emerging, 10% experimental) optimizes for portfolio stability. Its hidden assumption is that the proven 70% still returns well at its current scale. Nothing in the rule can detect that the largest channel has saturated while an emerging one is starved, because both are defined by share, not by what the last dollar produced.
Percent-of-revenue benchmarks answer the wrong question
The most cited external anchor is peer spending. Gartner's May 2025 press release on its 2025 CMO Spend Survey reports marketing budgets at 7.7% of company revenue, flat on the prior year. That figure is self-reported by Gartner's respondent base of enterprise marketing leaders, and it describes peer behavior. A company that lands exactly at the benchmark learns nothing about whether its own paid social has hit diminishing returns or whether its search line could absorb more. The benchmark is a description of a crowd, not a signal about one company's marginal return.
Funnel-stage splits assume the funnel is the causal model
Splitting spend by awareness, consideration and conversion optimizes for coverage of a diagram. It assumes each stage responds independently and that conversion spend causes the conversions it reports. Both assumptions fail whenever a lower-funnel channel is collecting demand created elsewhere.
| Allocation heuristic | What it optimizes | Hidden assumption | When it misleads | What replaces it |
|---|---|---|---|---|
| 70-20-10 | Portfolio stability | Proven channels still return at current scale | Largest line has saturated | Marginal return per channel |
| Percent of revenue | Alignment with peers and finance | Peer spend reflects your opportunity | Your response curves differ from the average | Decision-derived total |
| Funnel-stage split | Coverage of every stage | Each stage causes its own outcomes | Lower funnel captures demand created upstream | Verified incremental lift by channel |
The percent-of-revenue row rests on the Gartner 2025 CMO Spend Survey figure cited above; the other rows describe the mechanics of the heuristics rather than measured results.
Heuristics still have two honest uses: a first-year starting point when no measurement exists, and a sanity check against what finance expects. Everything that follows keeps the same total and reallocates it by decision, boundary, marginal return, testing capacity and partner return. A useful first exercise is to list the heuristics your current plan leans on and write beside each one the business question it cannot answer.
Start from the decision the budget has to inform
Start with the decisions, not the channels. Goal-oriented budgeting appears in nearly every guide, including the CFO-and-CMO framing from Abacum, but goals are usually listed rather than tied to thresholds that later govern where money moves. A budget exists to fund specific choices: enter a market, defend share, lower blended CAC, launch a product. Each carries a cost of being wrong, and that cost is what should size the line.
Name the two or three decisions the plan must survive
Limit the ledger to three decisions. More than that and the thresholds blur into a wish list. Write each one as a choice the company would make differently depending on the result, which is the test of whether it belongs in the ledger at all.
Translate each decision into a measurable outcome and a threshold
Write each decision as an outcome with a floor, for example incremental gross profit per media dollar above a stated level, rather than a proxy such as ROAS or lead volume. Proxies move for reasons unrelated to the decision; thresholds on incremental outcomes do not.
| Business decision | Outcome it requires | Threshold that funds it | Measurement method | Owner |
|---|---|---|---|---|
| Lower blended CAC while holding new-customer volume | Incremental new customers at lower cost | Incremental CAC below a stated ceiling | Geo holdouts on the two largest channels | Head of growth |
| Launch a product line in one region | Trial volume within the launch window | Incremental trials above a stated floor per dollar | Matched-market test | Product marketing lead |
| Defend share against a new entrant | Stable category share among target buyers | Leading brand indicator held above baseline | Tracked brand study plus mix model | Brand director |
The ledger above is a conceptual GPI framework; the rows are illustrative, not measured outcomes.
Brand fits this framing without special pleading. Brand spend is funded to move a measurable leading indicator over a defined period, not held as a fixed share.
Fix the total budget after the decisions, not before
The total is the sum of the funded decisions plus a reserve. Only then reconcile it against the percent-of-revenue expectation finance will bring; Gartner's flat 7.7% of revenue figure from its 2025 survey is exactly that kind of external anchor. Treat it as a check on reasonableness, not a target. Finish the one-page decision ledger before any channel is named.
Draw the budget boundary: working media, agency fees, tools and people
Before comparing channels, fix what the number includes. Four cost classes compete for the label marketing budget: working media, agency and partner fees, measurement and technology, and internal headcount. Templates such as the one from Funnel or the annual planning guide from Keen can help lay these out, but the inclusion decision is yours, and it changes every comparison downstream.
What belongs inside the media budget
| Cost class | Include in media budget? | Effect on channel comparison if excluded | How to allocate it to channels |
|---|---|---|---|
| Working media | Yes | None; this is the baseline | Directly by channel |
| Agency and partner fees | Yes | Flatters channels with heavy management overhead | Attach each fee to the channels it manages |
| Measurement and technology | Yes, at least the channel-specific share | Hides the cost of tools that exist only to run a channel | Split by usage or by spend share |
| Internal headcount | Optional, but be consistent | Understates in-house channels if fees are included but salaries are not | Time allocation by channel |
This is a boundary checklist for adoption, not a benchmark; no external cost figures are approved for this article.
Why agency fees must sit inside the allocation, not beside it
A fee changes the marginal return of the channel it manages. A channel that looks efficient on media-only ROAS can fall below threshold once management cost is loaded, and leaving fees outside the boundary also understates the cost of adding another partner. The Gartner press release excerpt reporting budgets at 7.7% of revenue does not specify which cost classes respondents counted, which is one reason a peer benchmark cannot be compared with your own number until your boundary is fixed.
Fully loaded cost per acquisition as the common denominator
Compute per channel: (media + attached fees + tooling share + measurement cost) divided by verified incremental acquisitions. A hypothetical example makes the gap visible. Two channels each spend 100,000 in media and each produce 1,000 acquisitions, so media-only cost per acquisition is 100 for both. Channel A runs in-house on a self-serve platform with 5,000 of tooling, giving a fully loaded 105. Channel B carries a 15% of spend retainer (15,000) and a 10,000 reporting tool, giving 125. These are invented round numbers, but the direction is the point: identical media efficiency hides a fully loaded gap of roughly a fifth, enough to flip which channel receives the next dollar. Restate last year's channel results on this basis and note which rankings change.
Fund each channel to its marginal return threshold, not to a share
The allocation rule is simple to state: fund each channel until its verified incremental return per marginal dollar falls to the threshold in the decision ledger, then move remaining dollars to the channel with the highest marginal return still above threshold. The work is in the word verified.
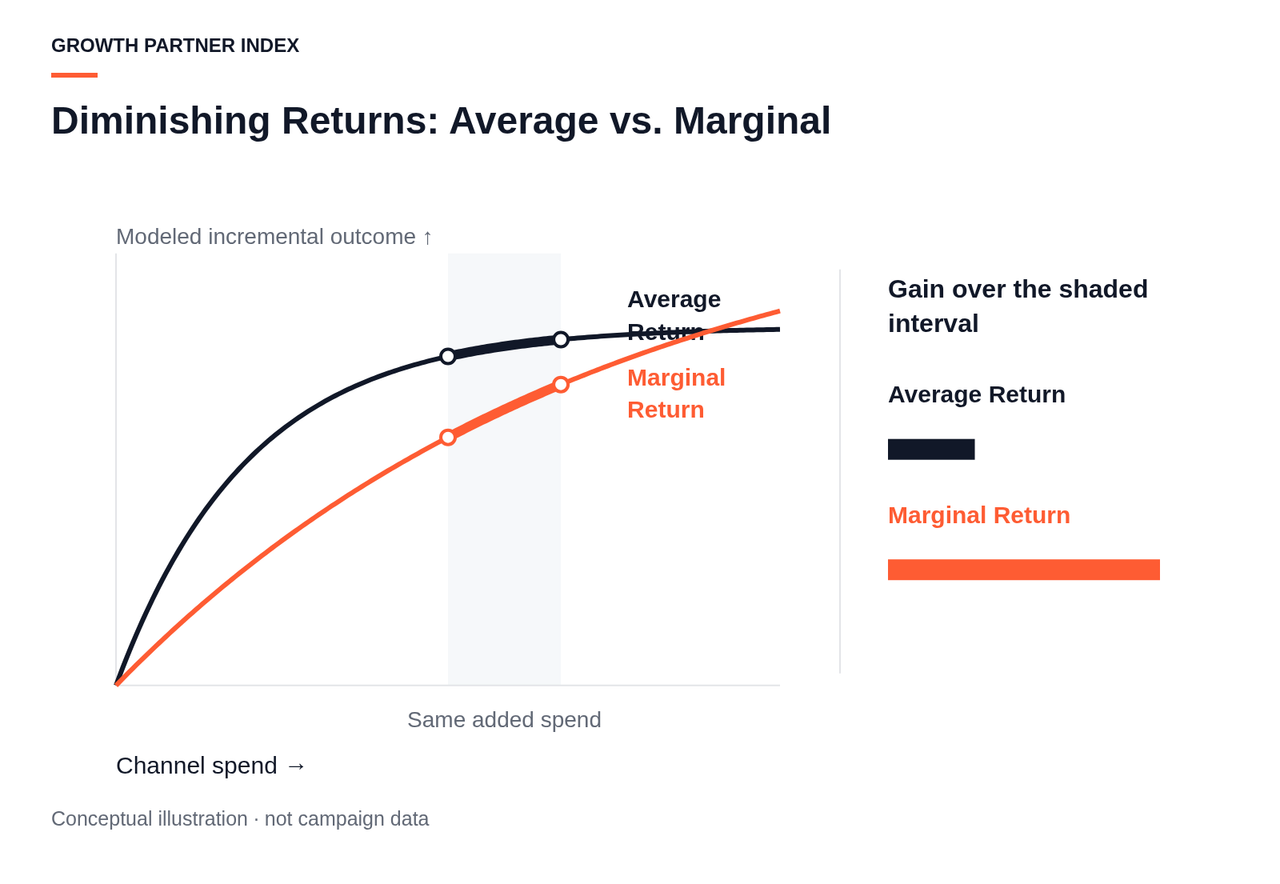
Response curves: why the next dollar earns less than the last
Every channel has a response curve. Early dollars reach the most responsive audience at the lowest auction pressure. Later dollars buy repeat frequency against the same people, push into colder segments, and bid up prices in a crowded auction. Average return, which is what a dashboard shows, blends the cheap early dollars with the expensive late ones. Marginal return is what the last dollar produced, and it is always lower than the average on a saturating curve. Mix modeling, as Ekimetrics describes it, exists largely to estimate those curves from aggregate data.
With budgets flat at 7.7% of revenue for the second year in Gartner's self-reported 2025 CMO Spend Survey, most leaders will not get growth from a larger total. It has to come from moving dollars between channels at the margin.
Setting the threshold where funding stops
The threshold comes from the decision ledger, not from the channel. If the decision is incremental gross profit per media dollar above a floor, then a channel keeps receiving budget only while its verified marginal return clears that floor. Brand channels are held to the same logic with one explicit difference: their curves are measured against leading indicators over longer windows, so the brand and performance split becomes an output of the process rather than an input.
| Channel | Current spend | Platform-reported return | Verified incremental return | Evidence quality | Marginal return at current spend | Action (increase, hold, cut, test) |
|---|---|---|---|---|---|---|
| Retargeting | 300,000 | 8.0x | 1.5x | Geo holdout, recent | Below threshold | Cut to cap, redeploy |
| Paid social prospecting | 500,000 | 2.5x | 2.2x | Geo holdout, recent | Above threshold | Increase |
| Branded search | 200,000 | 12.0x | Unknown | None | Unknown | Test before any increase |
| Connected TV | 250,000 | 1.2x | 1.8x (leading indicator lift) | Mix model calibrated by one test | Near threshold | Hold |
Every figure in this table is hypothetical and exists only to show the columns in use; no approved evidence supports specific lift values for any channel.
The bottom-of-funnel trap: capturing demand you already had
Branded search, retargeting and other demand-capture channels report the highest returns in most portfolios because their audiences were already on the way to buying. Platform attribution credits the last touch, so conversions that would have happened anyway appear as channel results. The effect is a portfolio that looks efficient while demand creation is starved. In the hypothetical retailer above, retargeting reports the top ROAS, a holdout shows most of those buyers convert regardless, and the line is capped with the difference moving to prospecting where the holdout showed positive lift.
Reading platform attribution as a claim, not a result
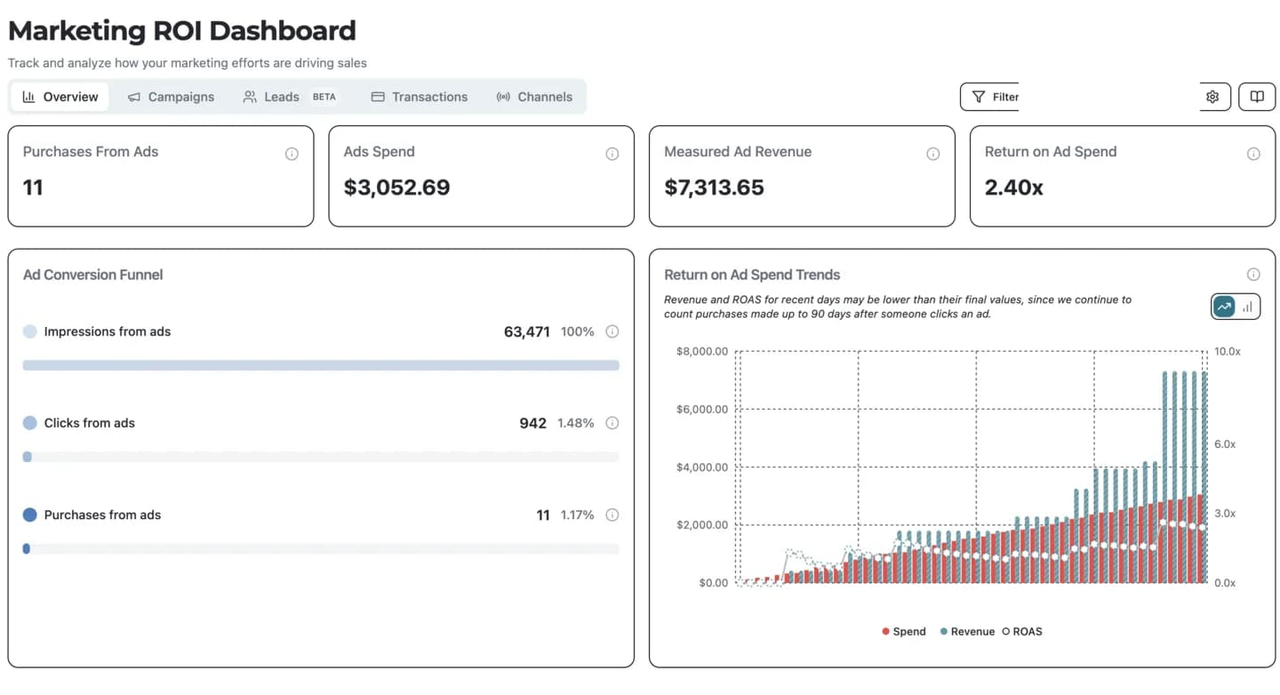
A platform-reported number is a claim about causation made by a party paid on volume. The route to a verified curve runs through holdouts, geo tests, or a mix model calibrated by experiments; the media planning guide from Measured frames planning around that distinction. When only part of the portfolio can be tested, rank channels by evidence quality, fund untested lines conservatively, and reallocate only from channels with verified marginal return below threshold to channels verified above it. The next section covers how to pay for that evidence.
Size the testing reserve by what you can actually measure
Set the reserve equal to the cost of the tests the decision ledger requires, not to a round share. The common advice to hold 10% for experiments has the same weakness as every other percentage: it says nothing about whether that money buys an answer.
Testing capacity, not a fixed percentage
A reserve funds a specific set of tests, each run at enough scale and for long enough to detect the effect size that would change a decision. Five inputs drive the cost: baseline conversion volume, the lift size that matters, the holdout share, test duration, and the opportunity cost of spend withheld in holdout regions. Larger effects and higher volumes need less time and money; small effects on low-volume channels can be impossible to detect within a quarter. That tradeoff bites harder when the total envelope is flat as a share of revenue, as in Gartner's 2025 survey, because every reserve dollar comes out of working media.
What a reserve has to buy: power, duration and clean geographies
Three purchases matter. Power, meaning enough volume in test and control to separate signal from noise. Duration, meaning a window long enough to cover the purchase cycle and any delayed response. Clean geographies, meaning regions that can be held out without contamination from national media or overlapping campaigns. A budget that funds a test without all three buys a number, not a decision. Even market research budgeting guidance, such as the primer from Luth Research, starts from the question the research must answer rather than a fixed percentage.
Sequencing tests across the year
Order the calendar by money at stake multiplied by evidence weakness. The largest spend line with the least verified return goes first, because a clear result there moves the most dollars. Each result feeds directly into the verified-return and evidence-quality columns of the marginal-return table.
| Channel or hypothesis | Decision it informs | Minimum detectable effect that matters | Test design | Estimated cost of withheld spend | Quarter scheduled |
|---|---|---|---|---|---|
| Largest paid social line | Increase or hold | Lift that moves incremental CAC across the ceiling | Geo holdout, extended window | Highest | Q1 to Q2 |
| Branded search | Cap or maintain | Any lift below the fee-loaded threshold | Paused-region test | Moderate | Q2 |
| Retargeting | Cap level | Lift that changes the cap by a material amount | Audience holdout | Low | Q3 |
| New channel exploration | Kill or scale | Pre-agreed scale rule | Capped pilot with control | Capped line | Q4 |
The calendar is conceptual; the cells describe design choices, not measured costs or results.
When the reserve is too small to learn anything
An underpowered test produces an inconclusive result, and inconclusive results get read as confirmation by whoever wants the budget and as failure by whoever wants it back. A hypothetical brand with modest weekly conversions cannot detect a small lift on a minor channel within a quarter, so it declines that test and instead runs a longer geo holdout on its largest line, where a clear answer changes the most money. New-channel exploration belongs on a separate, capped line with a kill-or-scale rule agreed before launch. Cost a four-quarter test calendar and set the reserve to that cost plus the exploration cap.
Fund agency retainers as a spend line with its own return test
Treat each retainer as an allocation with an expected incremental contribution. The fee is justified when the channel's verified return with the agency, after the fee, exceeds what the organization could achieve without it. That is the same test media faces, applied to the line most budgets leave unexamined.
Separate the fee from the media it manages
Once fees sit inside the boundary, the renewal question becomes concrete: does this partner raise the channel's verified marginal return by more than it costs? Answering that requires seeing the fee and the media as distinct lines with a shared result, not one blended number.
What an agency must show before its line is renewed
At renewal, an agency should supply the methodology behind any claimed result, the measurement window, the counterfactual used, known limitations, and direct access to raw platform data. A result without a counterfactual is a report of activity. GPI's own methodology applies a similar standard when scoring agencies: documented claims, stated limitations and verifiable records rather than testimonials.
Fee structures and the incentives they create
| Fee structure | Incentive it creates | Interaction with marginal-return rule | Evidence to require at renewal | Risk if unverified |
|---|---|---|---|---|
| Percentage of spend | Recommend more media | Fee rises with spend even as marginal return falls | Verified lift at current and proposed spend levels | Budget creep past threshold |
| Flat retainer | Minimize effort per dollar managed | Neutral on spend, weak on optimization pressure | Evidence of active reallocation within the channel | Stale allocation |
| Performance-linked | Optimize the metric in the contract | Aligned only if the metric is verified incremental return | Counterfactual behind the paid metric | Payment for captured demand |
The table describes incentive mechanics; it does not report measured outcomes for any fee model.
The percentage-of-spend model deserves particular attention when the total is not growing. With budgets flat at 7.7% of revenue in Gartner's 2025 respondent base, a fee that grows only when media grows competes directly with the reserve and with every other channel for the same fixed dollars. Guides such as Venture Harbour's cover how to set and optimize budgets, but the incentive embedded in the fee itself rarely gets the same scrutiny.
Reading agency-reported results without taking them on trust
Agency-reported attribution is evidence to evaluate, not proof. In a hypothetical case, a paid social agency on a percentage-of-spend fee proposes a budget increase citing platform ROAS. The buyer funds a geo holdout from the reserve. If verified incremental return after fee clears the ledger threshold, the increase is approved. If it does not, the line is held and the fee structure is renegotiated. The buyer pays for the holdout rather than accepting the dashboard, because the dashboard was produced by the party requesting the money.
This is also where a documented partner record helps before a contract exists. GPI publishes agency profiles that lay out a listing's documented claims and limitations; a profile such as AMZ-Marketing shows the form of record a buyer should expect to assess. It is an example of documentation, not a recommendation, and GPI has not run or audited any campaign for a listed agency. For every retainer, write the incremental contribution it must demonstrate, the incentive risk in its fee structure, and the evidence required at renewal, then schedule the verifying test in the reserve calendar.
Align finance and marketing on one reallocation cadence
Hold one pre-budget session with finance and leave it with three signed items: the threshold, the evidence hierarchy, and the reallocation triggers. The rest of the year then runs on those agreements rather than on argument.
Agree the threshold and the evidence standard before the year starts
Build a shared glossary so that return means verified incremental return, not platform ROAS. Agree an evidence hierarchy, from randomized holdout at the top through geo test and calibrated mix model down to platform attribution at the bottom. Then set the threshold from the decision ledger. This matters more when the envelope is not growing; finance will anchor on a top-down figure like Gartner's flat 7.7% of revenue, so the productive conversation is about how the fixed total moves, not whether it grows.
Quarterly reallocation triggers
| Trigger | Evidence required | Who approves | Maximum reallocation without new test | Follow-up test |
|---|---|---|---|---|
| Verified test result | Holdout or geo test meeting the agreed standard | CMO with finance sign-off | Full amount the result supports | Confirmation read in the next quarter |
| Marginal return crossing threshold | Calibrated model or test at current spend | Media lead | Pre-agreed cap per quarter | Holdout on the receiving channel |
| Fee renewal date | Agency evidence package | CMO | None until evidence reviewed | Verifying holdout from the reserve |
| Material change in unit economics | Finance-validated margin or price change | CFO and CMO | Re-run of threshold, then reallocation | As required by new threshold |
What does not trigger movement: a swing in a platform dashboard. The cadence is conceptual; the caps and approvers are placeholders for your own governance.
Planning for signal loss: aggregate methods over user-level tracking
As user-level identifiers degrade, methods that depend on tracking individuals across sites lose coverage. Geo experiments, holdouts and mix modeling run on aggregate data, which is why the framework here rests on them. The privacy-first measurement primer from Cassandra covers the same shift toward first-party and aggregate approaches. An allocation built on aggregate evidence does not need to be rebuilt when an identifier disappears.
Governance: who can move money and on what proof
Adopt a one-page reallocation memo for every in-year move: the decision, the evidence and its place in the hierarchy, the amount moved, the approver, and the test that will confirm the move. In a hypothetical arrangement, a CFO and CMO agree that no channel may receive more than a fixed quarterly increase without a verified test, which stops mid-year creep driven by attribution dashboards. Finance alignment guidance such as Abacum's covers the planning relationship; the memo is what makes it hold under pressure.
Building a media budget that survives scrutiny: the GPI view
Run next year's draft budget through six checks in order:
- Decisions and thresholds: no more than three, each with an outcome, a floor and a named measurement method.
- Boundary: fees, tooling and measurement loaded onto the channels that use them.
- Marginal return per channel: platform claims separated from verified return, with an evidence grade.
- Testing reserve by capacity: a costed calendar plus a capped exploration line.
- Partner lines with their own return test: incremental contribution, fee incentive and renewal evidence written down.
- Governance: triggers, caps and a memo for every move.
Flag any line funded without a threshold, a boundary or an evidence plan. A budget is a set of claims about where money will earn a return, and each claim deserves the standard GPI applies when scoring agencies: methodology, counterfactual and limitations. Rebuilt this way, the same total tends to shift from demand capture and unverified retainers toward tested prospecting and a right-sized reserve.
This approach costs more in measurement and management time than a percentage rule, and for a small budget with one or two channels the rule may be the rational choice. It becomes the better choice when the spend at stake exceeds the cost of learning, which for most media leaders is true on at least their largest lines.
GPI's contribution sits on the partner line. Before funding an agency line, see how GPI documents partner records in listings such as AB Marketing Group, so the fee can be allocated with the same rigor as media.
FAQ
How do I allocate a budget when only some channels can be tested for incrementality?
Rank every channel by evidence quality and fund untested lines conservatively until a test is scheduled. Verified channels above threshold get increases first; unverified channels are held at or below current spend, and the reserve calendar prioritizes whichever untested line carries the most money.
Should brand spend be held to the same marginal return threshold as performance spend?
The same logic, different window. Brand lines are funded to move a leading indicator agreed in the decision ledger, measured over a period long enough for the effect to appear. What changes is the measurement horizon and the indicator, not the requirement for evidence.
How much of the budget should the testing reserve be?
Whatever the costed test calendar requires, plus a capped exploration line. The right size depends on conversion volume, the effect sizes that matter and the number of lines that lack evidence, so it varies year to year and should shrink as more of the portfolio becomes verified.
What should an agency provide before I increase its media budget?
A methodology for the claimed result, the measurement window, the counterfactual, known limitations, and raw platform access. If those are missing, fund a holdout from the reserve before approving the increase and make the result the basis for renewal.
Do agency fees belong in the marketing budget or in operating expenses?
For allocation purposes they belong inside the budget, attached to the channels they manage, regardless of how the general ledger classifies them. Otherwise channel comparisons systematically favor the lines with the heaviest management overhead.
How do I handle a channel whose platform ROAS is high but whose holdout shows little lift?
Cap it at the level where verified marginal return still clears threshold, which may be well below current spend, and redeploy the difference to a channel with verified lift. Keep a minimal presence if brand protection or competitive coverage justifies it, but treat that as a defensive cost, not a return.
How often should the allocation be revisited?
On triggers, checked quarterly: a verified test result, a threshold crossing, a fee renewal or a change in unit economics. Fixed calendar reshuffles without new evidence add noise, and dashboard swings alone should never move money.
