

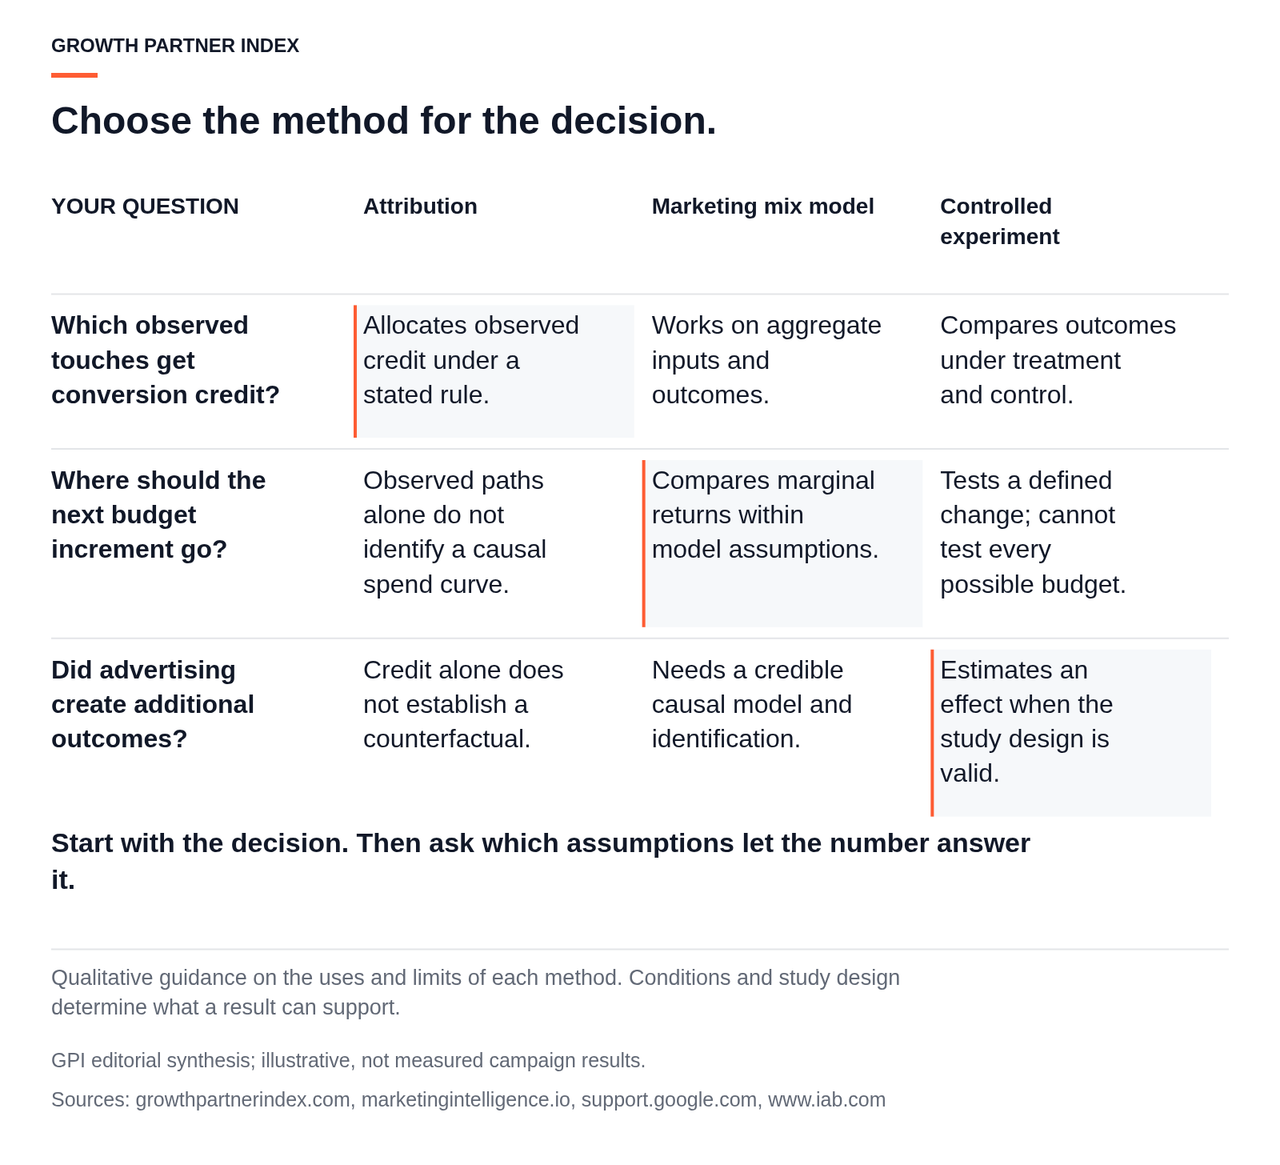
A channel can receive credit for a purchase without causing it. Attribution credits observed touchpoints; marketing mix modeling estimates relationships across aggregate spend and outcomes. Those numbers answer different questions. When Google made Meridian available to everyone in January 2025, it described Bayesian causal inference that blends prior knowledge with observed data. Assumptions therefore matter alongside inputs. This guide to attribution vs marketing mix modeling explains the decisions each method supports, their limits and how experiments connect them.
If an agency already bills you on attributed results, GPI's guide to auditing the fee trigger in performance marketing agreements covers how to separate credited conversions from incremental ones in the contract itself.
TL;DR
- Attribution allocates credit among observed touchpoints under a stated rule and window. On its own it describes credited outcomes and does not measure additional business.
- Marketing mix modeling regresses aggregate outcomes such as sales on aggregate inputs, and can carry offline media, price, distribution and seasonality as variables.
- Attribution supports in-flight, within-channel optimization where identity data is complete. MMM supports cross-channel budget envelopes at a monthly or quarterly cadence.
- Signal loss degrades attribution because the pipeline depends on stitching user-level identifiers. Regression on aggregates needs no user identifier.
- Neither method is causal by construction. Controlled experiments with credible counterfactuals supply the calibration both lack.
- Require any agency or vendor to state which method produced a number and to document the causal evidence behind any label of incremental.
Growth Partner Index reads measurement debates through one question: what decision is this number allowed to make? Attribution and marketing mix modeling both produce plausible figures, and both are sold as if the figure were the point. It is not. A credit rule tells you which touchpoints were present; a regression tells you how aggregate inputs moved with aggregate outcomes. Neither tells you what would have happened otherwise, and that counterfactual is what a budget decision actually needs. So we assess every method, and every agency presenting one, on the evidence behind the claim, the assumptions the method carries and the limits its own authors admit. Attribution is a description. Causation has to be earned.
Attribution vs marketing mix modeling: two different questions, not two answers to one
For multi-touch attribution vs marketing mix modeling, the key distinction is the unit of analysis. Attribution asks which observed touchpoints preceded a conversion and how credit should be split among them. Marketing mix modeling asks how much aggregate outcomes moved when aggregate inputs moved, after accounting for other factors. The MMM vs MTA debate concerns different questions with different units of analysis, so different numbers for the same channel are the expected result rather than a contradiction. Supermetrics' discussion comparing MTA and MMM explores these differences; the publisher also provides a transcript.
What attribution actually computes
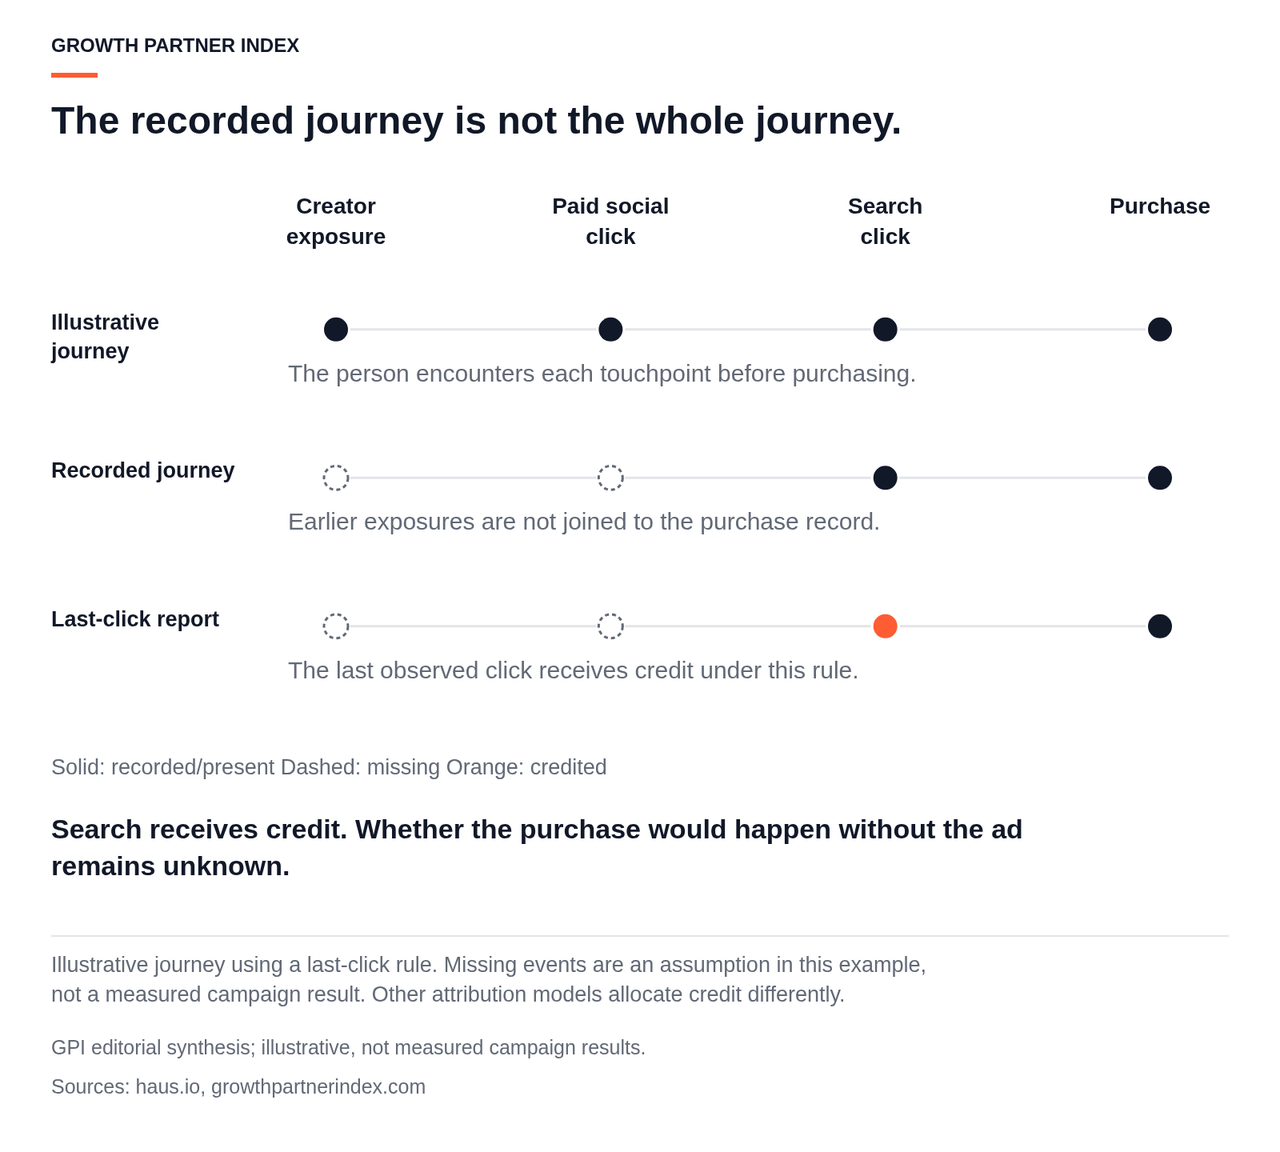
Multi-touch attribution starts by collecting user-level event data: impressions, clicks, pageviews and conversions, each precisely timestamped so events can be ordered into a journey. Haus describes the pipeline as four steps: collect events, stitch journeys, apply a credit rule, then aggregate to campaign or channel. The credit rule is a convention. Last click gives everything to the final touch; linear splits evenly; time decay weights recent touches; data-driven models learn weights from observed paths. Change the rule or the lookback window and the channel totals change without anything changing in the market. That is why GPI's fee-trigger analysis insists that attributed reporting describes credited outcomes under a stated rule and window rather than additional business.
What marketing mix modeling actually estimates
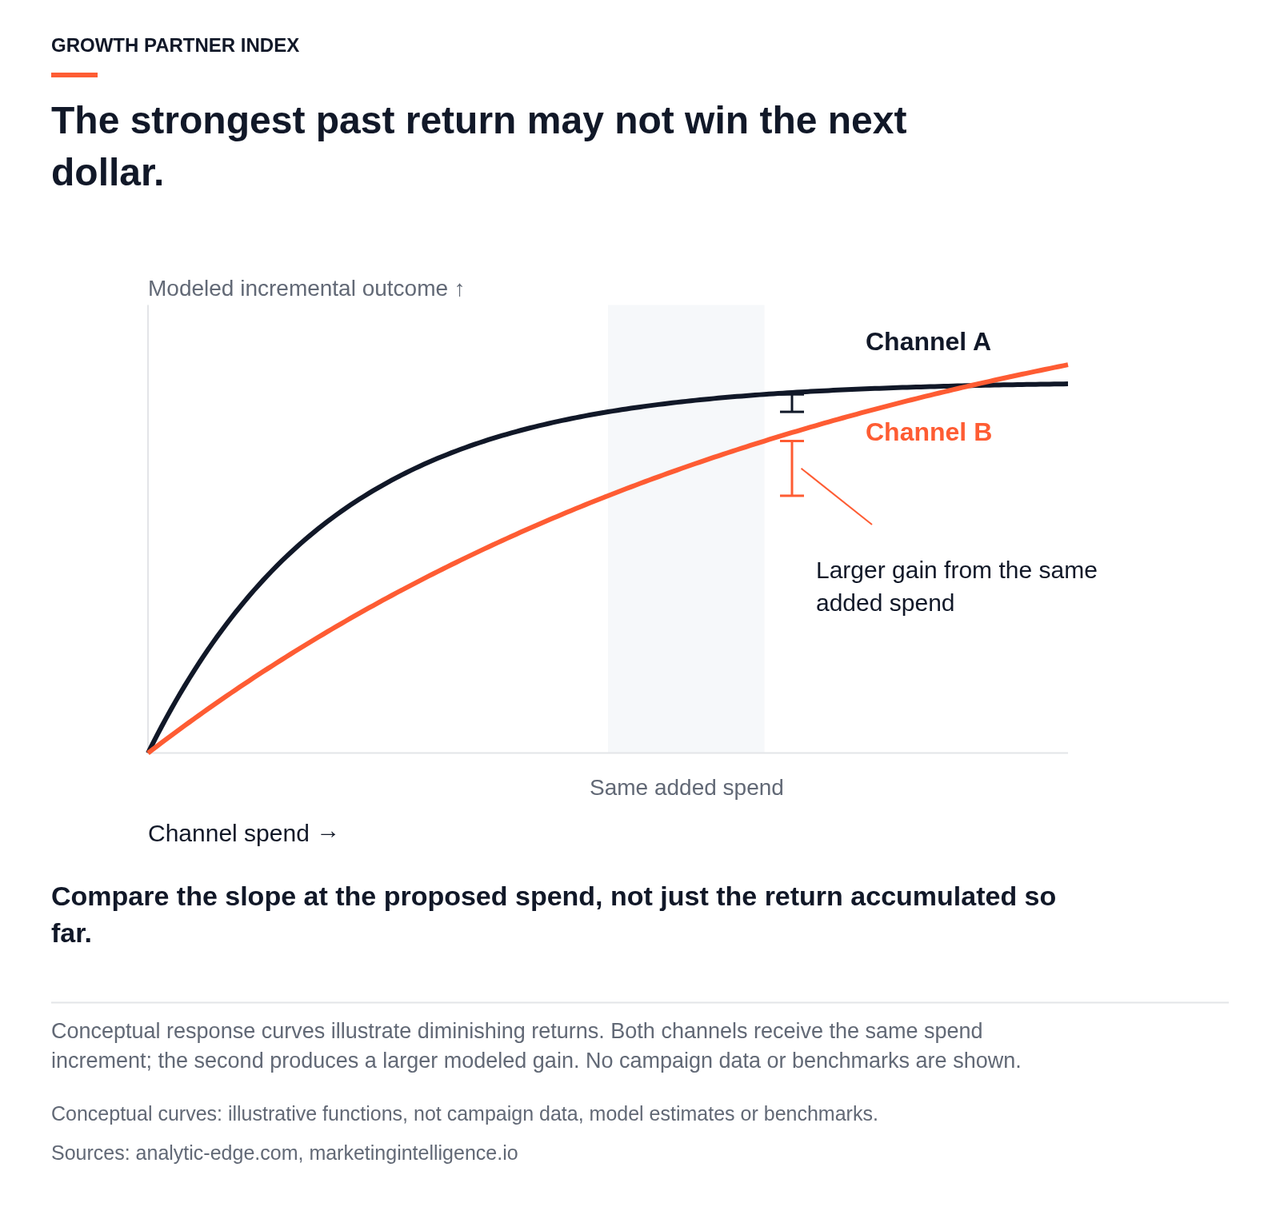
Marketing mix modeling works at what Marketingintelligence.io calls the macro level: a statistical model relating marketing cost or exposure to a target metric such as revenue, new customers or installs, without any user path. Analytic Edge lists the typical regression setup, with sales or market share as the dependent variable and distribution, price, TV, digital, outdoor, print and promotions among the independent variables. Two transformations do most of the work. Carryover, often called adstock, lets spend in one period affect outcomes in later periods. Saturation curves let each additional unit of spend return less than the last. Those two components are what allow a model to speak to marginal return rather than average return, which Keen argues is the figure that should drive allocation. Bayesian implementations such as Meridian add priors: the model blends prior knowledge with observed data, so the buyer should ask to see the priors and who set them.
Why the two produce different numbers for the same channel
Attribution counts conversions credited inside a window from tracked paths. MMM estimates a coefficient across the whole modeled period, including effects that never produced a trackable click and effects of offline media. A hypothetical illustration: a paid social line shows a 3x ROAS in the platform and a 1.4x coefficient in the model. The platform figure includes conversions that would have happened anyway but carried a recent click; the model figure spreads credit against seasonality and other channels moving on the same calendar. Neither has been checked against a counterfactual, so neither is yet proof.
| Dimension | Multi-touch attribution | Marketing mix modeling | Implication for the reader |
|---|---|---|---|
| Unit of analysis | Individual user journey | Time period, often by geography | The methods cannot be reconciled by averaging |
| Data inputs | Timestamped user-level events with identifiers | Aggregate spend, impressions, outcomes plus controls | MMM can include channels with no click path |
| Output type | Credited conversions per touchpoint | Coefficients and response curves per input | Attribution shows presence; MMM shows association |
| Time horizon | Lookback window, days to weeks | Modeled history, typically many months or years | MMM is slow to react; attribution is slow to see long effects |
| Channel coverage | Trackable digital touchpoints | Any channel with a spend or exposure series | Offline mix needs MMM |
| What changes the answer | Rule and window choice | Model specification, priors, controls | Ask what was chosen in each case |
Table structure draws on the pipeline breakdowns from Haus and the top-down versus bottom-up framing from Marketingintelligence.io.
Prefer to read, or having trouble with the player? Read the discussion on Supermetrics.
Which media decisions each approach can actually support
Frame marketing mix modeling vs attribution around the decision and its cadence. Match the method to the decision by matching the unit of analysis to the thing being decided. A bid change inside one platform is a user-level decision made with that platform's data. A quarterly shift of budget from TV to search is an aggregate decision across channels. Digital Applied frames the split as fast cycles with clean tracking versus offline-heavy, long-cycle, low-tracking situations; the table below extends that framing to specific decisions and to what should be in hand before acting.
Weekly and in-flight decisions: creative rotation, bids, audience exclusions
Attribution owns these when the channel's own data is complete. Choosing between two creatives, adjusting a bid cap or excluding an audience segment happens inside one platform, on the platform's own events, at a cadence no regression can match. Improvado's guidance on when to use each method makes the same point about tactical speed. Attribution also answers a question MMM cannot answer at all: which touchpoints were actually present in the paths that converted. The limit is that within-channel ranking says nothing about whether the channel as a whole earned its budget.
Monthly and quarterly decisions: channel budget envelopes and new channel entry
MMM is matched to cross-channel envelopes because it can hold price, seasonality and competitor activity as controls while comparing channels that never share a click path, and because saturation curves speak to what the next dollar returns. New channel entry is harder. A model has no historical spend on a channel it has never seen, so its recommendation rests on priors or analogies, so treat entry as an experiment rather than a modeled allocation.
Annual decisions: total media investment and offline mix
Of the two, only MMM can inform total investment and the online versus offline split, because it is the only one that carries offline media as inputs. Stellans summarizes the division as MMM for strategic budget and ROI across online and offline and attribution for digital tactics. The boundary is the observed spend range. Scenario simulations that push a channel far beyond its historical spend are extrapolations along a curve the data never traced.
Decisions neither method should own alone
Launching or cutting a channel, claiming incremental revenue to finance, and setting a performance fee on incremental outcomes all require a counterfactual. Attribution provides credited counts; MMM provides associations after controls. Relabeling either as incremental needs an explanation of the causal evidence connecting the number to additional business, and Measured's decision tree reserves that role for incrementality testing. Decision rights should be written down: who acts on which number, at what cadence, and what happens when the two disagree. The operating cadence section below gives the disagreement protocol.
| Decision | Typical cadence | Method best matched | Why the unit of analysis fits | What to require before acting |
|---|---|---|---|---|
| Creative rotation | Daily to weekly | Attribution within platform | User-level events on one platform | Documented rule and window; path completeness measured |
| Bid and budget pacing inside a channel | Daily to weekly | Attribution within platform | Same data the bidding system uses | Awareness that ranking within channel says nothing about channel value |
| Audience exclusions and frequency | Weekly | Attribution within platform | Per-user exposure data | Check that exclusions do not remove the control group of a running test |
| Channel budget envelope | Monthly to quarterly | MMM | Aggregate outcomes across all channels with controls | Full spend coverage; diagnostics reviewed; recent calibration recorded |
| New channel entry | Quarterly | Experiment first, then MMM | No history exists for the model | Powered holdout design before scaling |
| Annual investment and offline mix | Annual | MMM constrained to observed spend range | Only method carrying offline inputs | Scenario ranges flagged where they extrapolate |
| Cutting or launching a channel | As needed | Experiment | Requires a counterfactual | Study power confirmed; result dated |
| Fee trigger on incremental outcomes | Contract term | Experiment-validated outcomes or controllable inputs | Attributed counts reward the rule, not the work | Method disclosed in the contract |
Rows extend the decision framing published by Digital Applied and the three-method split described by Measured; the attributed versus incremental distinction follows GPI's fee-trigger analysis.
What signal loss did to attribution, and why aggregate modeling survives it
Attribution depends on identity resolution, and identity resolution is exactly what browser tracking prevention, mobile app tracking consent frameworks and third-party cookie restrictions have degraded. Aggregate modeling does not depend on it, which is the main reason MMM has returned to favor. Kochava described the shift as MMM having a moment in 2024, and House of Martech frames the whole comparison as a privacy-first measurement question. The research behind this article contains no verified percentage for how much path data has been lost, so none is stated here. Measure completeness in your own stack instead.
Where identity resolution breaks in the attribution pipeline
The failure sits in the first two of Haus's four steps. Step one requires granular, timestamped user-level events; step two stitches them into journeys using identifiers. When an identifier is missing or restricted, the touch cannot be joined to the conversion. The conversion still happens and still gets credited, but credit defaults to whatever touch remains observable, which is usually a late click on a logged-in platform or a branded search. The result is a systematic tilt, and AI Digital argues this is why rule-based attribution models no longer work as a channel-value measure.
Why regression on aggregates does not need a user identifier
MMM inputs are spend, impressions and outcomes summed by period and often by geography. Nobody needs to know which person saw which ad. The macro-level correlation between exposure and outcome is estimated from movement in the totals. Google releasing Meridian as open source is a reasonable signal that platforms expect aggregate methods to carry more weight.
What still depends on the platforms
MMM inputs come from platform reporting. Spend and delivery are generally reliable, but modeled conversions inside platforms are themselves estimates and should not be fed into a model as ground truth. Durability is also distinct from accuracy. A method that survives signal loss can still be biased.
The assumptions and data each model needs before you trust it
Before acting on either method, confirm the preconditions. Attribution needs complete paths and a documented rule; MMM needs history, variance and full spend coverage. Both need diagnostics a buyer can inspect.
Attribution preconditions: path completeness and a documented rule
Require the rule and window in writing, and require a measured path-completeness figure: the share of conversions whose preceding touches could actually be joined. Set an internal threshold below which user-level numbers inform only within-channel ranking. The research behind this article found no sourced industry threshold, so the threshold is a management choice to make explicitly rather than borrow.
MMM preconditions: history, variance and complete spend coverage
A regression needs enough periods to estimate a curve and enough variation within each channel to distinguish its effect. A channel spent at a flat level every week gives the model nothing to learn from. Supermetrics notes that MMM requires a relatively large budget and variation to work, and flags B2B as a difficult environment. Coverage matters as much as volume. Spend that is correlated with a modeled channel can have its effect absorbed into that channel's coefficient. Require a complete spend ledger and documented exclusions before acting on the model.
MMM failure diagnostics a buyer can ask about
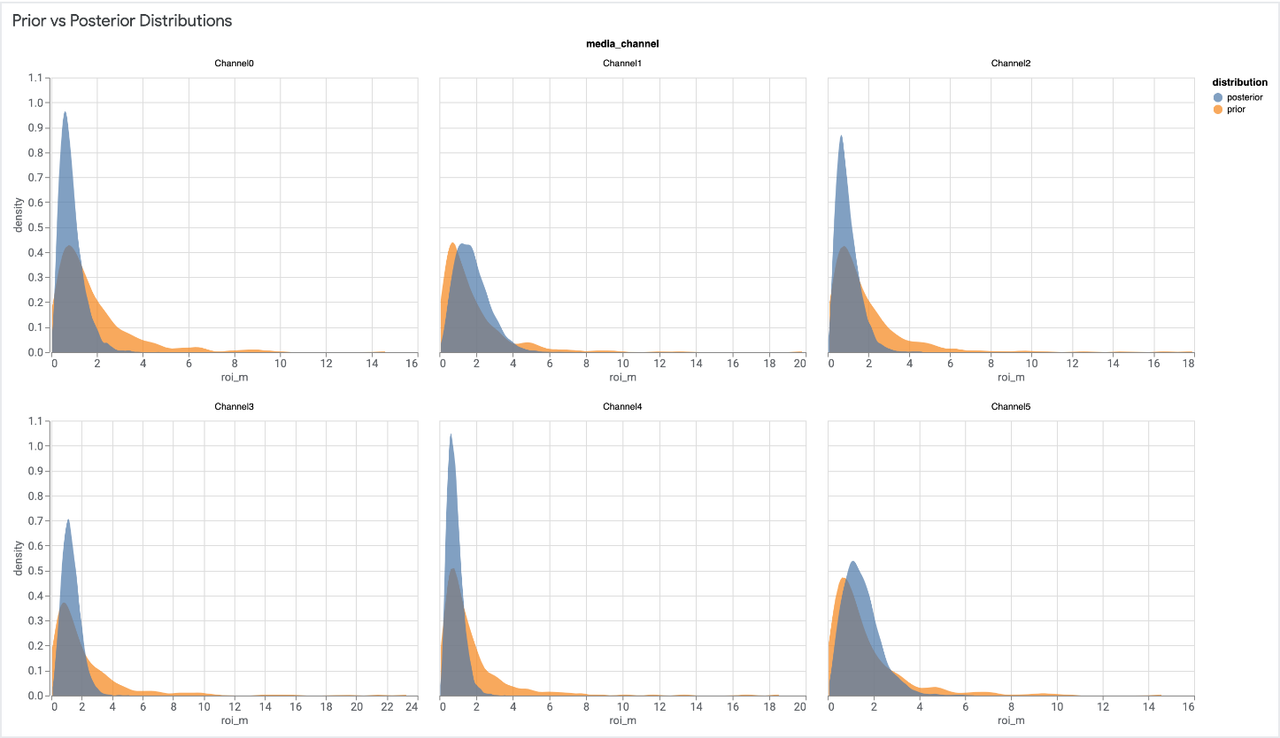
Multicollinearity is the most common. When two channels are flighted on the same calendar, such as TV and search lifted together for a promotion, the regression cannot separate them, and the coefficients become unstable. Ask for variance inflation factors or an equivalent diagnostic. Then check plausibility: a negative coefficient on a channel that was actively running, a saturation curve whose upper range contains no observed data, or a Bayesian posterior that barely moves from its prior are each signs the model is telling you what it was told rather than what it found. Digital Applied's failure modes list missing spend, too little history and no experimental validation; add collinearity and coefficient sign checks to that list.
Cost of ownership without a price list
No verified pricing or staffing data exists in the research for this article, so cost is described by component. Attribution costs sit in tag and server-side event infrastructure, identity stitching and vendor licensing. MMM costs sit in data engineering to assemble every spend line, analyst or vendor time to fit and refresh, and governance time to act on results. Open-source engines remove license fees but not labor; MarTech's 2025 stack survey reports homegrown martech surging, which shifts cost from licenses to people rather than removing it.
| Precondition or diagnostic | Applies to | Question to ask the vendor or agency | Warning sign in the answer |
|---|---|---|---|
| Rule and window | Attribution | Which rule and lookback produced this number? | Cannot state it or changes it between reports |
| Path completeness | Attribution | What share of conversions have joined paths? | Figure unknown or not tracked over time |
| History and variance | MMM | How many periods and how much spend variation per channel? | Flat spend channels reported with confident coefficients |
| Spend coverage | MMM | Which spend lines are excluded and why? | Offline or agency-managed spend missing |
| Collinearity | MMM | Which channels move together and how was that handled? | No diagnostic offered |
| Priors | Bayesian MMM | Who set the priors and how much do they drive results? | Posterior mirrors prior |
| Plausibility | MMM | Any negative or out-of-range coefficients? | Results presented without a review of signs |
Diagnostic rows build on the failure modes published by Digital Applied and the regression setup described by Analytic Edge.
Neither model proves incrementality without an experiment
Neither attribution nor MMM proves lift. Both are observational. An experiment with a credible counterfactual is the only one of the three approaches that measures what would have happened without the advertising.
Attributed is not incremental
An attributed conversion is a conversion that carried a touch inside the window. It says nothing about whether the touch changed behavior. GPI's fee-trigger analysis puts it plainly: a change of label from attributed to incremental needs an explanation of the causal evidence connecting the two. The retargeting and branded search problem follows from the rule itself. Those touches sit closest to conversion by design, so most crediting rules reward them heavily regardless of whether they caused anything. Supermetrics makes the sharper version of this point, arguing that attribution measures clicks and clicks alone. A data-driven model changes the weighting but still operates only on observed paths.
Why regression coefficients are also not causal by default
MMM controls for more than attribution does, but a coefficient is still an association. Marketingintelligence.io describes the method as finding correlation between marketing cost and target metrics. Confounding is the main threat: spend is often timed to demand, so a model sees spend and sales rise together and cannot tell which caused which. Simultaneity and omitted variables add to that. Supermetrics notes that MMMs typically ignore the counterfactual. A coefficient is a well-informed hypothesis about causation, and it needs testing.
What a credible counterfactual requires
The IAB's guidelines for incremental measurement rest on three principles: credible counterfactuals, control of bias and separation of signal from noise. Two experiment forms meet them at the level this article's evidence supports. User-level holdouts, such as platform conversion lift studies, randomly withhold ads from a group and compare outcomes. Geographic holdouts withhold or vary spend across matched regions and compare aggregate outcomes, which works for channels with no user identifier. Adasight's 2026 overview treats these as the third leg alongside attribution and MMM.
Study power: knowing whether an experiment can even answer
A test that cannot detect the effect it is looking for returns a null result that proves nothing. Google Ads documents Conversion Lift feasibility, also called Study Power, as an estimate of the certainty of results and the likelihood of measuring the true causal impact. Confirm power before running, and report it alongside the result. Experiment results then feed back in two directions: as calibration priors or constraints for the next MMM refresh, which is what Meridian's prior-blending design accommodates, and as channel-level correction factors applied to attributed ROAS.
The same standard of counterfactual evidence and disclosed limitations informs how GPI assesses agency outcome claims in its published evaluation methodology.
How to run attribution, modeling and experiments as one operating cadence
Write a one-page operating protocol covering four things: decision rights, refresh rhythm, disagreement handling and calibration records. Funnel calls the combined approach unified marketing measurement and Adsmurai recommends combining both; the label is useful when it names a loop with experiments in it and empty when it names a blended dashboard without them.
Step 1: Assign decision rights by method and cadence
- Publish the decision table from earlier in this article, adapted to your channels. Channel managers act on attribution for within-channel choices. Finance and the planning team act on MMM for cross-channel envelopes. Nobody acts on an incremental claim that has not been tested. Two rules prevent conflicting instructions: channel managers never receive an MMM coefficient as a bid target, and finance never receives platform ROAS as an incremental return.
Step 2: Set the refresh rhythm
- Attribution refreshes continuously because platforms produce it continuously. MMM refreshes monthly or quarterly, depending on how fast spend and the market move; Adsmurai's continuous MMM workflow is one published shape for this. Experiments run on a rolling calendar prioritized by two factors: the size of the disagreement between methods and the size of the budget at stake.
Step 3: Define the disagreement protocol
- This is the step most published guidance skips. When attribution and MMM diverge on a channel beyond an agreed tolerance, follow a fixed sequence. First, freeze cross-channel reallocation for that channel; within-channel optimization continues. Second, check the data preconditions in order: path completeness on the attribution side, then omitted spend and collinearity on the model side, because a precondition failure explains many divergences without any experiment. Third, if preconditions hold, run or reference a powered experiment on that channel before either number wins. Fourth, record which number the experiment supported and adjust decision rights if a pattern emerges. The tolerance is a management choice, not a statistic from any source used here; set it relative to the budget at stake, tighter for large lines and looser for small ones.
Step 4: Calibrate and document
- Each completed experiment becomes a prior or constraint for the next MMM refresh and a correction factor for that channel's attributed results. Record the vintage of every calibration, since a lift result from eighteen months ago under a different creative and audience mix is weak evidence today. Funnel's guidance on feeding experiment results into models describes the mechanics.
Run this loop and the two systems stop competing. Attribution informs the fast decisions it can see. MMM informs the slow decisions it can estimate. Experiments decide which of the two to believe where they disagree, and both get better with every dated calibration.
What to require from an agency or vendor proposing either
Add a measurement-disclosure requirement to your next RFP or agency review. The requirement has three parts.
Ask which method produced every number
Every reported return should carry its method: attributed under a named rule and window, modeled with specification disclosed, or tested with the experiment design and power stated. A single blended figure labeled true ROAS with no method disclosed is the first red flag. Stellans is right that neither model is universally better; a partner who cannot say which one produced a number cannot say what decision it supports.
Separate attributed from incremental in reporting and in fees
Performance fees tied to attributed outcomes reward whatever the crediting rule rewards, which as the incrementality section showed is disproportionately retargeting and branded search. GPI's fee-trigger analysis, linked in the introduction, covers how to tie fees instead to experiment-validated outcomes or to inputs the agency directly controls. For MMM proposals, ask for input coverage, history length, the diagnostics described above, prior disclosure and at least one experimental validation, since omitted spend and undisclosed priors are the two easiest ways for a model to flatter its author.
Ask for limitations, not just results
GPI's published methodology, linked in the previous section, assesses agency outcome claims on whether they rest on documented counterfactuals and validation evidence rather than attributed reporting alone. Apply the same lens. A partner who volunteers where their model is weak, which channels are collinear and which lift tests failed is showing you evidence; a partner who refuses to share diagnostics is asking for trust.
| Requirement | Why it matters | Acceptable evidence | Red flag |
|---|---|---|---|
| Attribution rule and window in writing | The rule defines the number | Documented rule, window and change log | Rule changes between reports |
| Causal evidence for any incremental claim | Attributed counts are not lift | Experiment design, power and dated result | Incremental used as a synonym for attributed |
| MMM input coverage | Omitted spend biases coefficients | List of every spend line and exclusions | Offline or partner spend missing |
| MMM diagnostics | Collinearity and sign errors mislead allocation | VIF or equivalent, coefficient review | Diagnostics withheld |
| Prior disclosure | Priors can drive results | Priors listed with rationale | Cannot explain priors |
| Experimental validation | Models need calibration | At least one powered test per major channel | Unified measurement marketed with no experiments |
| Fee trigger basis | Fees shape behavior | Fees on tested outcomes or controlled inputs | Fees on platform-attributed ROAS |
Checklist rows derive from GPI's fee-trigger analysis, the IAB's incremental measurement principles and the MMM failure modes published by Digital Applied.
GPI perspective: choosing measurement that answers a decision you actually have to make
Choosing between attribution and modeling matters less than deciding which decision each number is allowed to drive and what evidence stands behind it. Attribution describes which touches were present; modeling describes how aggregates moved together; only an experiment with a credible counterfactual describes what the advertising added. A team that holds those three roles apart will make fewer expensive reallocations on numbers that were never designed to justify them.
Three commitments follow. Publish decision rights so channel managers and finance act on the method matched to their decision. Run at least one powered experiment on the channel where the two methods disagree most. Require method disclosure from every partner, and treat any label of incremental without causal evidence as a claim still waiting for its proof.
For a broader set of questions to put to a prospective partner, including how they measure and report, see GPI's guide on how to choose a growth marketing agency.
Frequently asked questions
When attribution and marketing mix modeling give different ROAS for the same channel, which number should the channel manager act on this week?
Check data preconditions before letting either number trigger a cross-channel reallocation. Within-channel creative and bid decisions can use attribution when tracking is adequate; a powered experiment can help resolve a material disagreement. Use the MMM estimate at the next budget-envelope review.
Does marketing mix modeling work for B2B companies with long sales cycles and low conversion volume?
MMM can work for B2B, but sparse outcomes and long sales cycles make identification harder. A higher-volume outcome such as qualified pipeline may help if it represents the business decision and the model has sufficient history and spend variation. Supermetrics describes B2B as a tricky environment; ask vendors to explain their outcome choice and data requirements.
Is open-source MMM tooling like Meridian a substitute for a measurement vendor or agency?
Open-source tooling removes license fees while leaving the modeling work to your team. Assembling spend inputs, choosing defensible priors, running diagnostics and validating estimates against experiments still require expertise. Google's Meridian announcement describes the role of prior knowledge; ask who chose those priors and how sensitive results are to them.
Why does attribution keep rewarding retargeting and branded search, and does switching to a data-driven model fix it?
Last-click rules credit the final observed touchpoint, which often favours branded search or retargeting. Data-driven attribution changes the weighting across observed paths, but that alone cannot establish what would have happened without advertising. A credible holdout experiment can test additional impact.
How much of my attribution data needs to be complete before I trust it for tactical decisions?
There is no universal completeness threshold established by the sources reviewed here. Measure path completeness, track how it changes, and set a documented tolerance before using the results for tactical decisions. Ask vendors how missing identifiers affect the journey-stitching step.
How often should experiments run if MMM refreshes quarterly and attribution runs continuously?
Use a rolling calendar guided by decision importance, measurement uncertainty and feasible study power. Prioritize consequential disagreements between methods, checking Conversion Lift feasibility before interpreting a study. Record each experiment's date, scope and uncertainty so its findings can inform the next model review.
